 Website details
Design & developmentElements 2 · Interactions 2
 motionlab
Explore the elements and interactions of each service, then try the related motion examples.
35 websites
Sources and usagePlay a sketch to see how each product interaction works, or enlarge it to compare the two states.
No matching studies. Try another term, change the source or reset your filters.
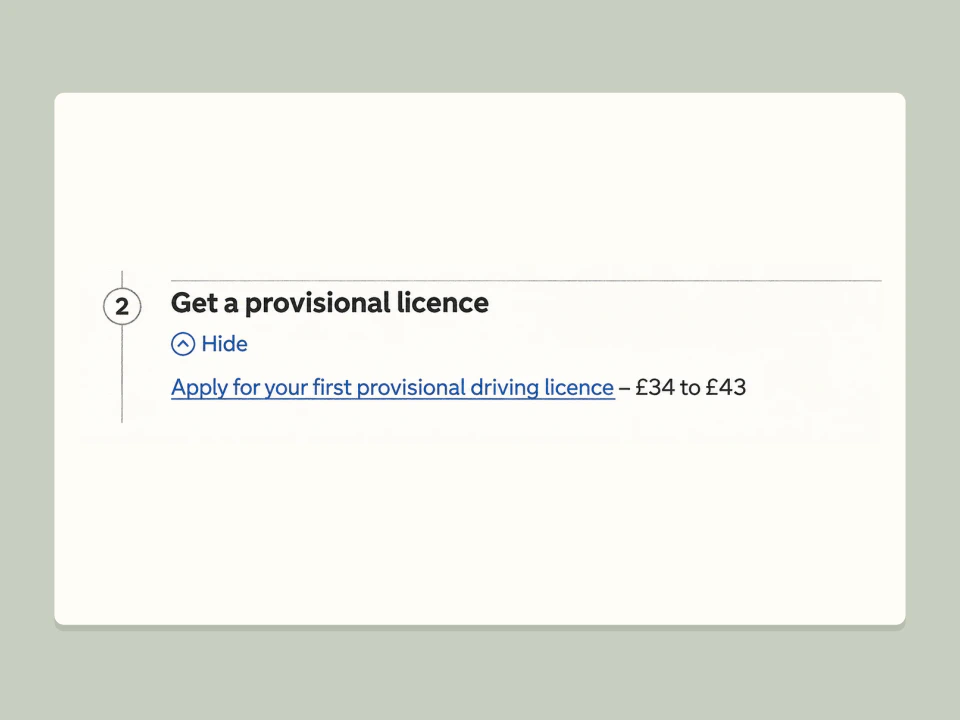
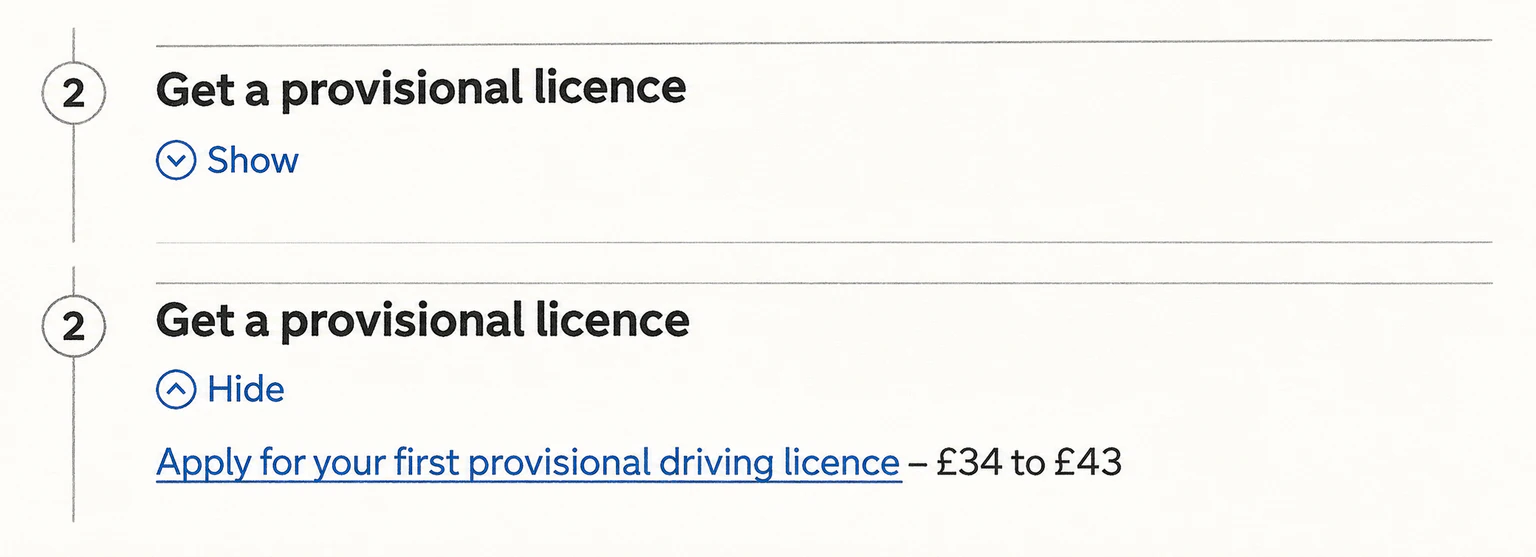
Expand step 2 of the driving guide to see the provisional licence application link and fee.
Design Museum · 2013 Design of the Year ↗

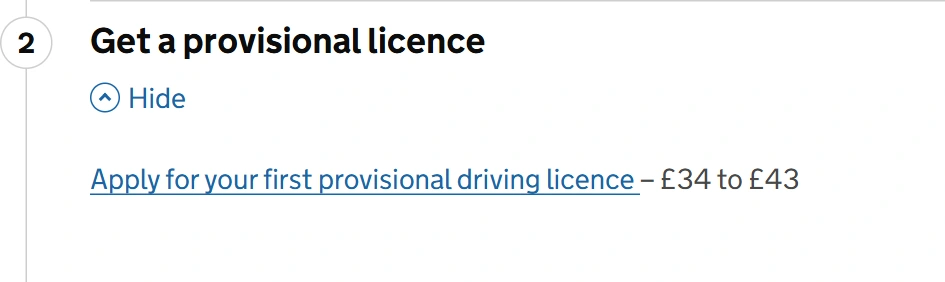
Opening step 2 reveals the provisional licence application link and its cost.
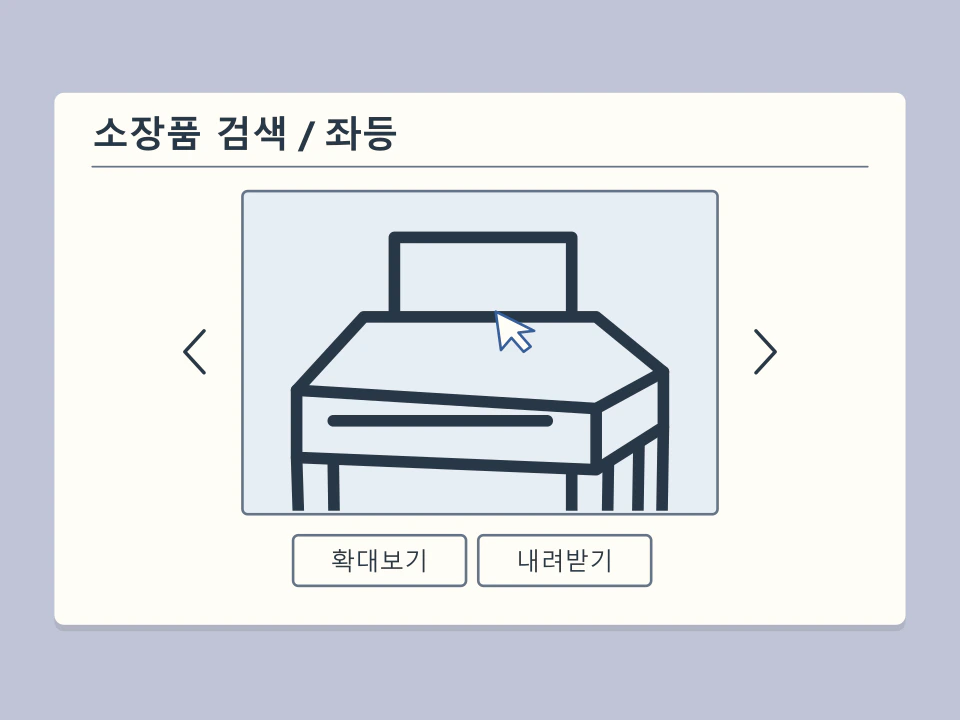
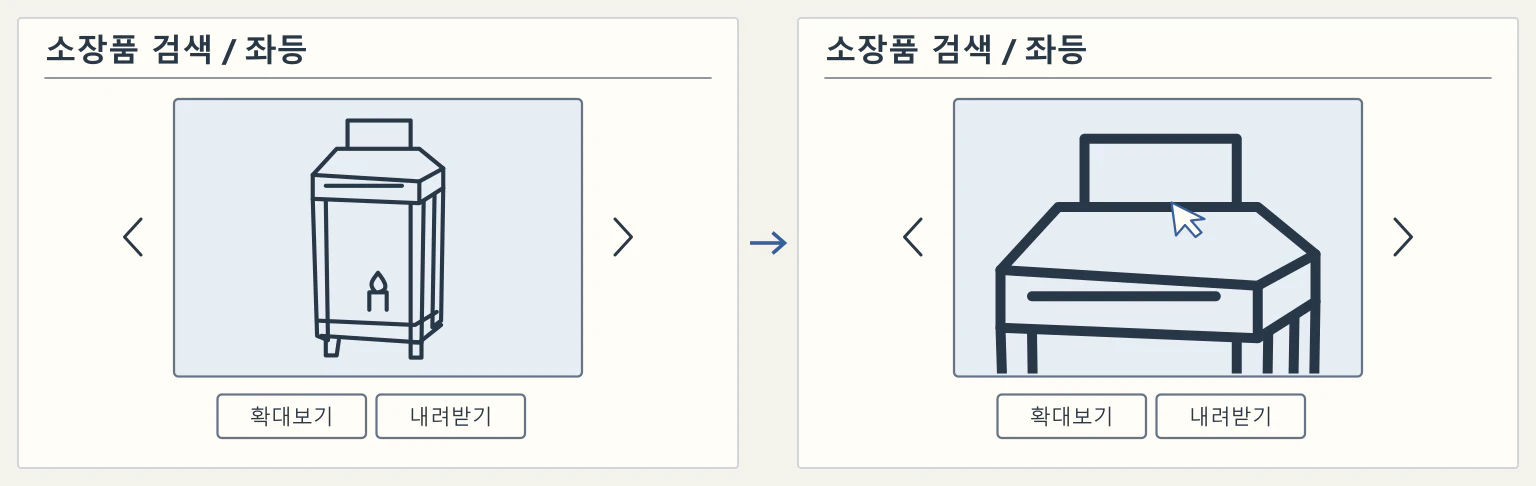
GOV.UK · © Crown copyright. Contains public sector information licensed under the Open Government Licence v3.0.Hover over a photograph in the lamp’s collection record to magnify its details. The previous and next arrows show the same object from other angles.
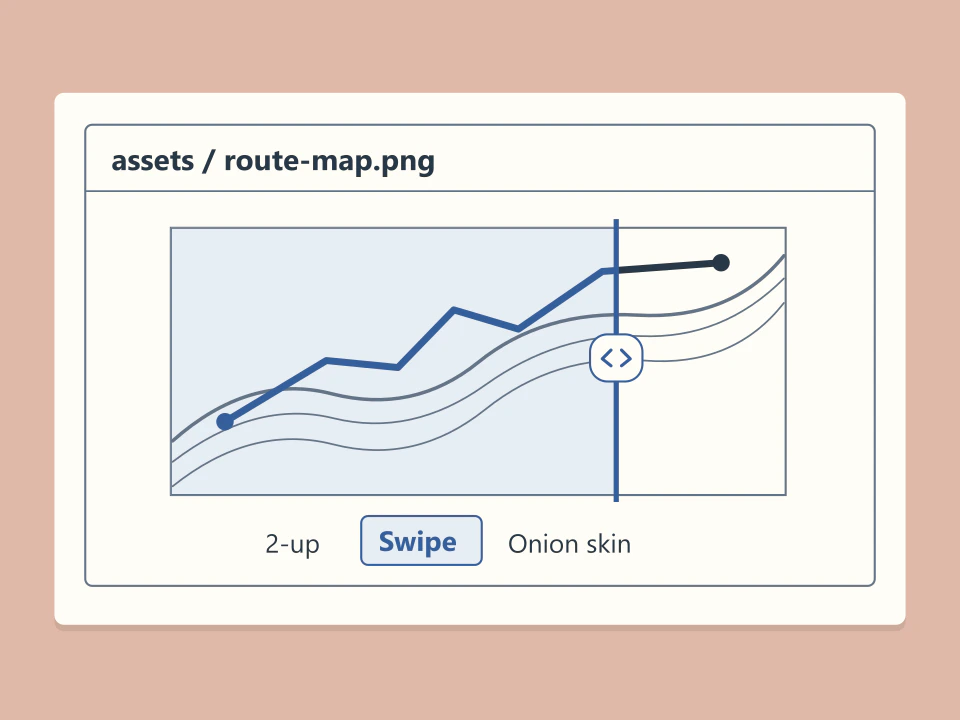
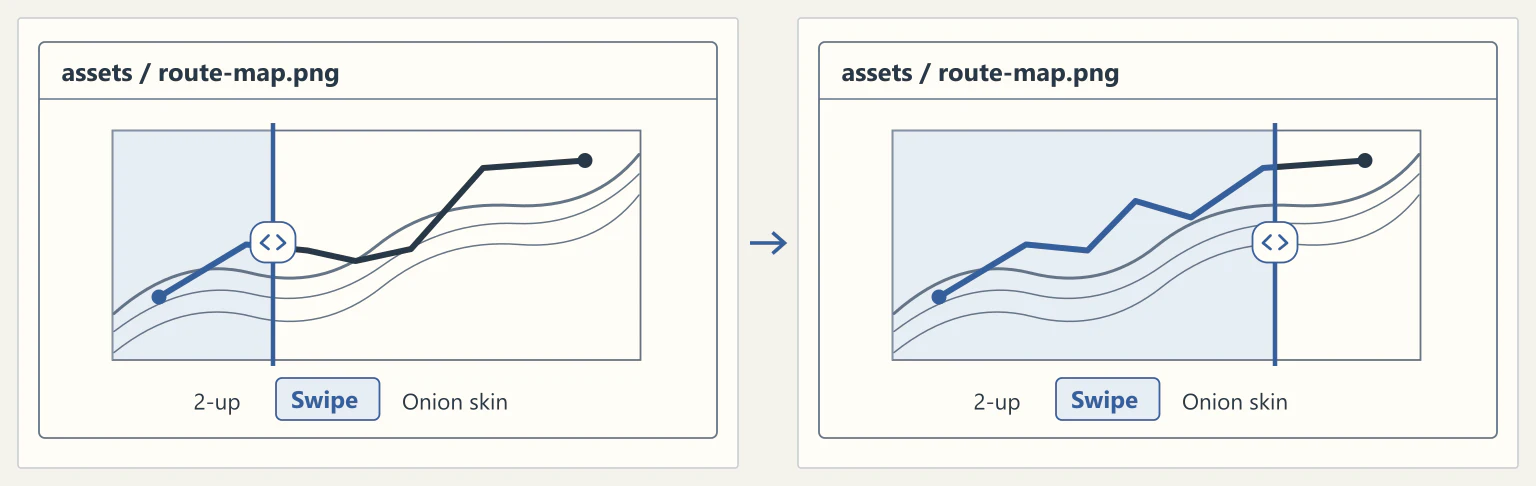
In an image diff, choose Swipe and drag the divider across a detail. Crossing the edge of an icon, for example, reveals the same pixels in the earlier and later versions.
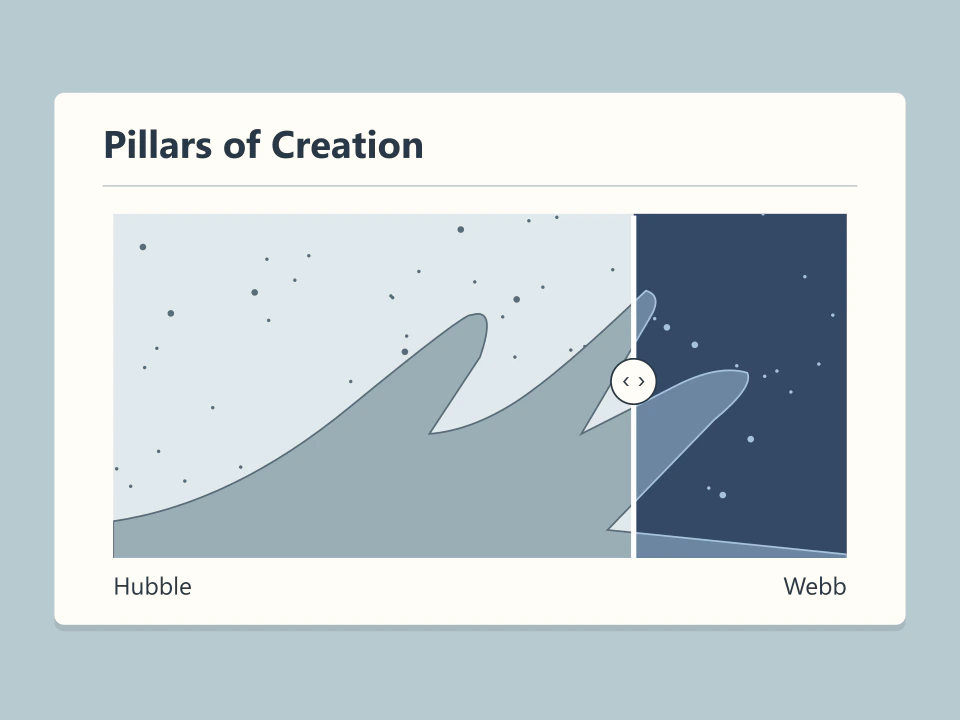
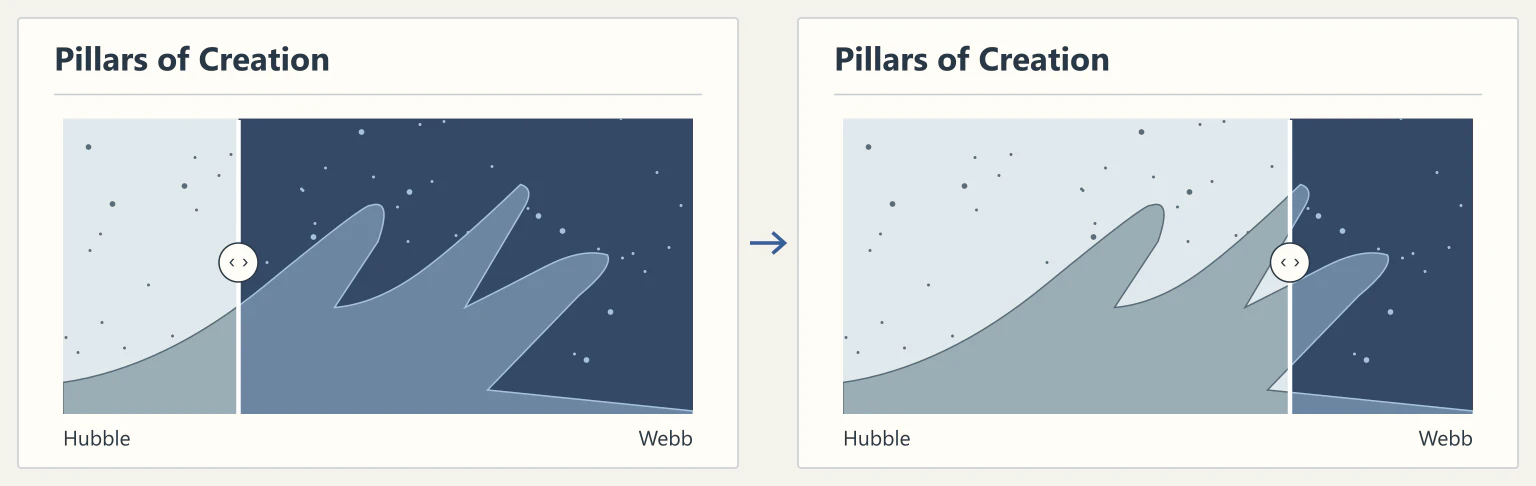
Drag the divider across the Pillars of Creation to compare the Hubble and Webb observations of the same region.
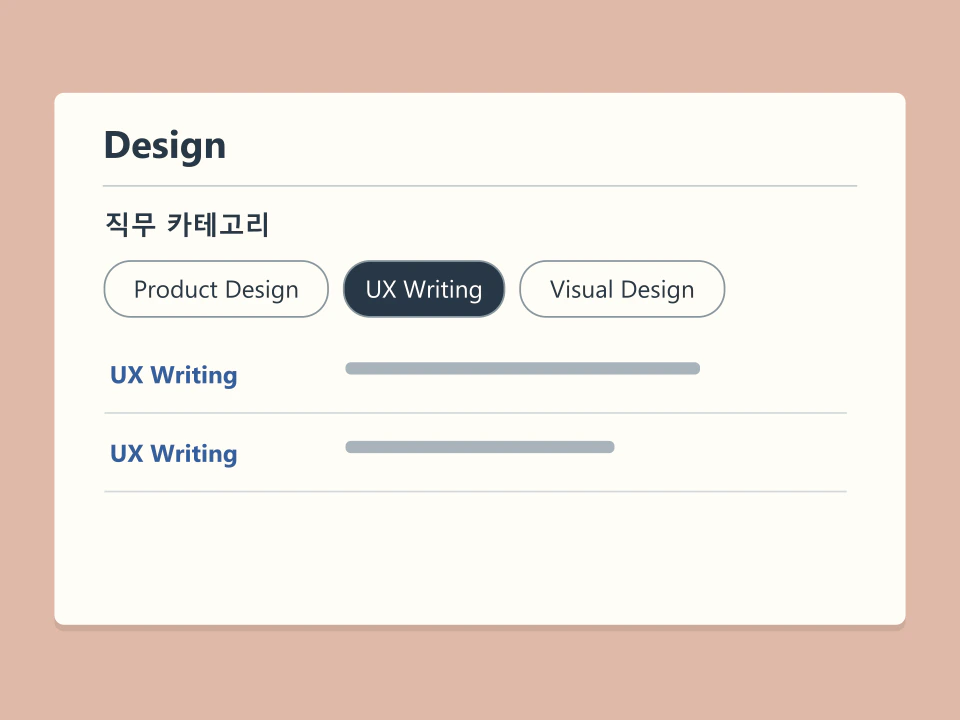
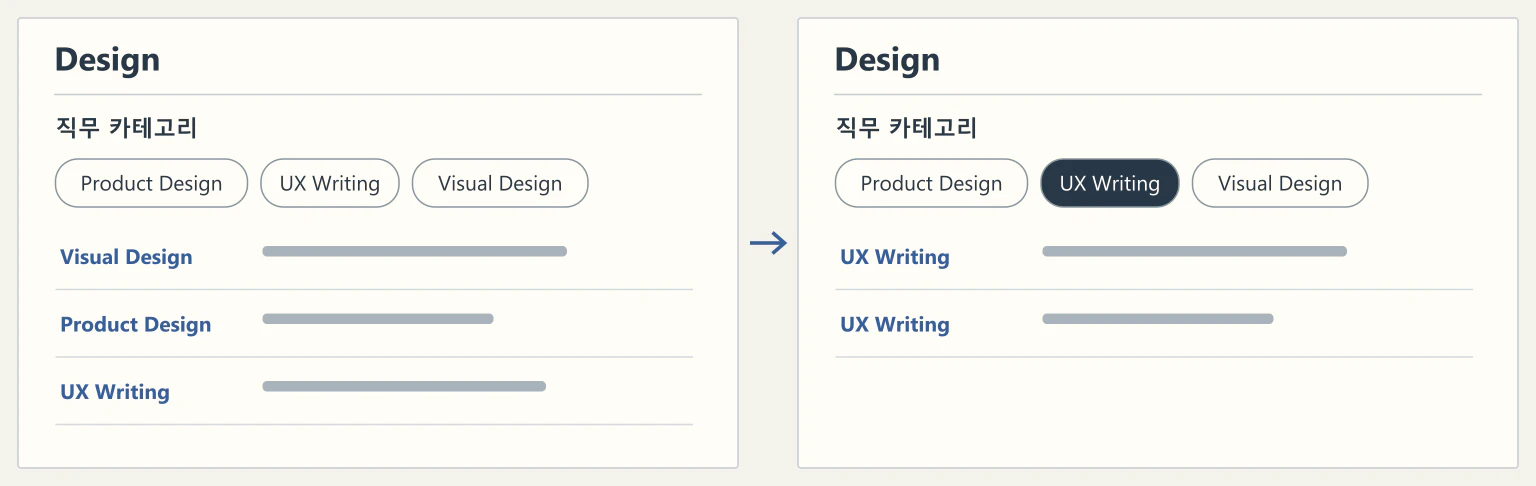
Select a discipline such as UX Writing to narrow the design article list.
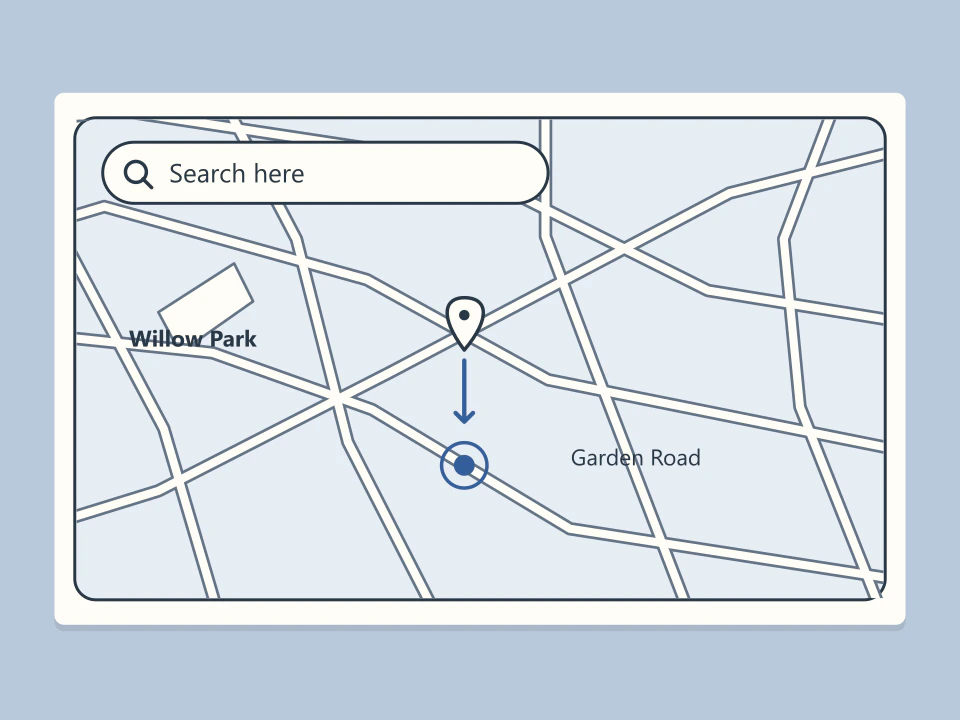
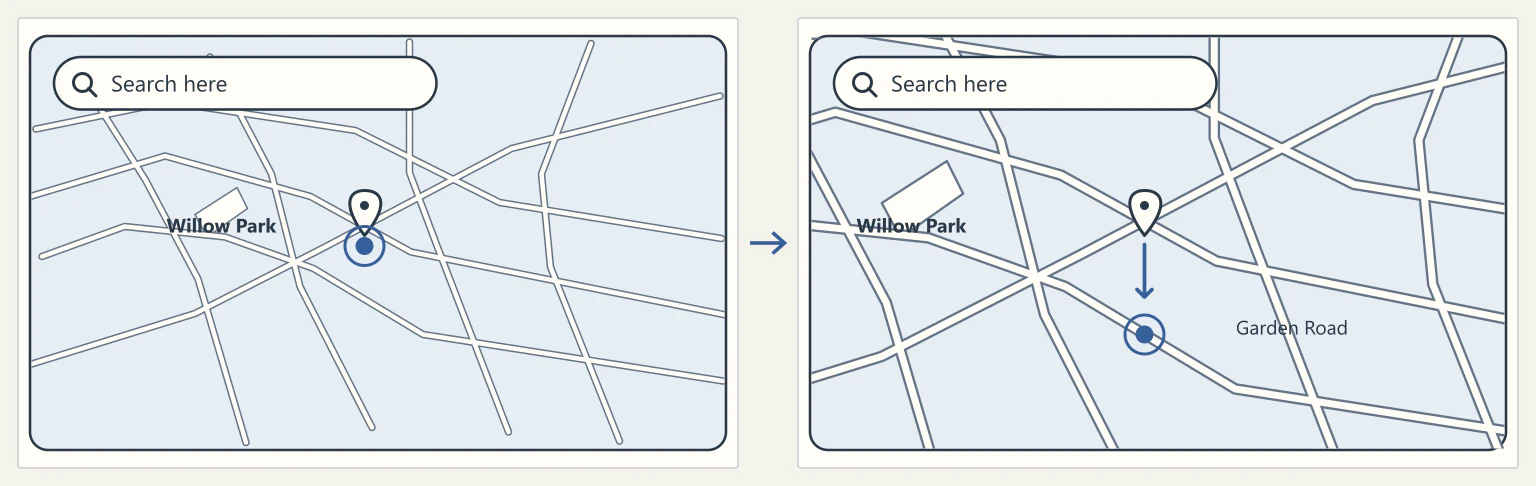
On the Android map, double-tap a spot and keep your finger down on the second tap. Drag down to zoom in on that spot or up to see a wider area.
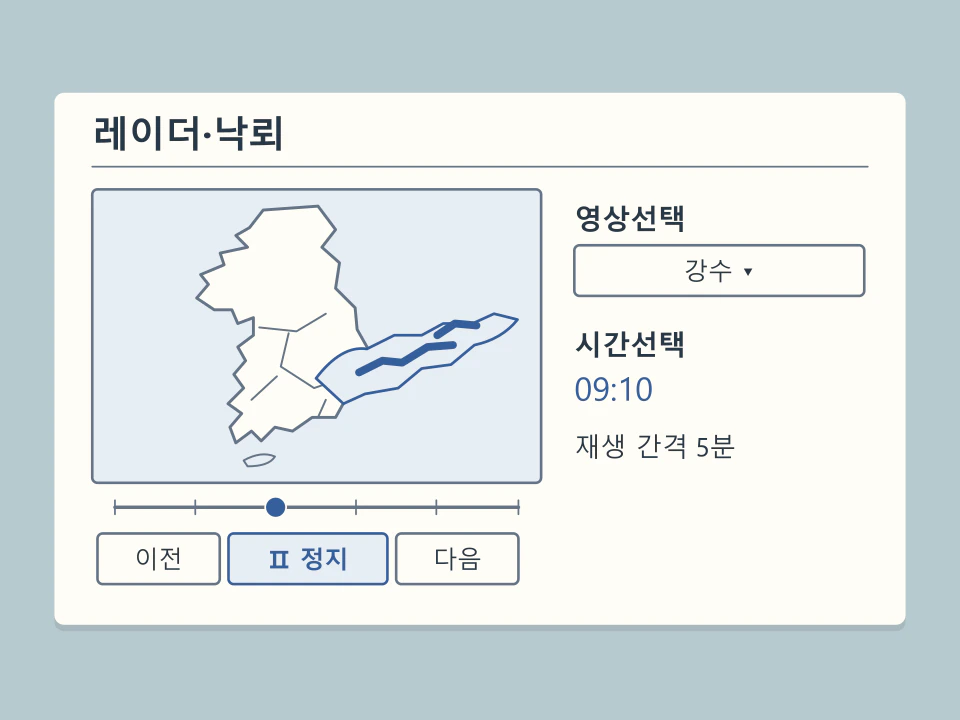
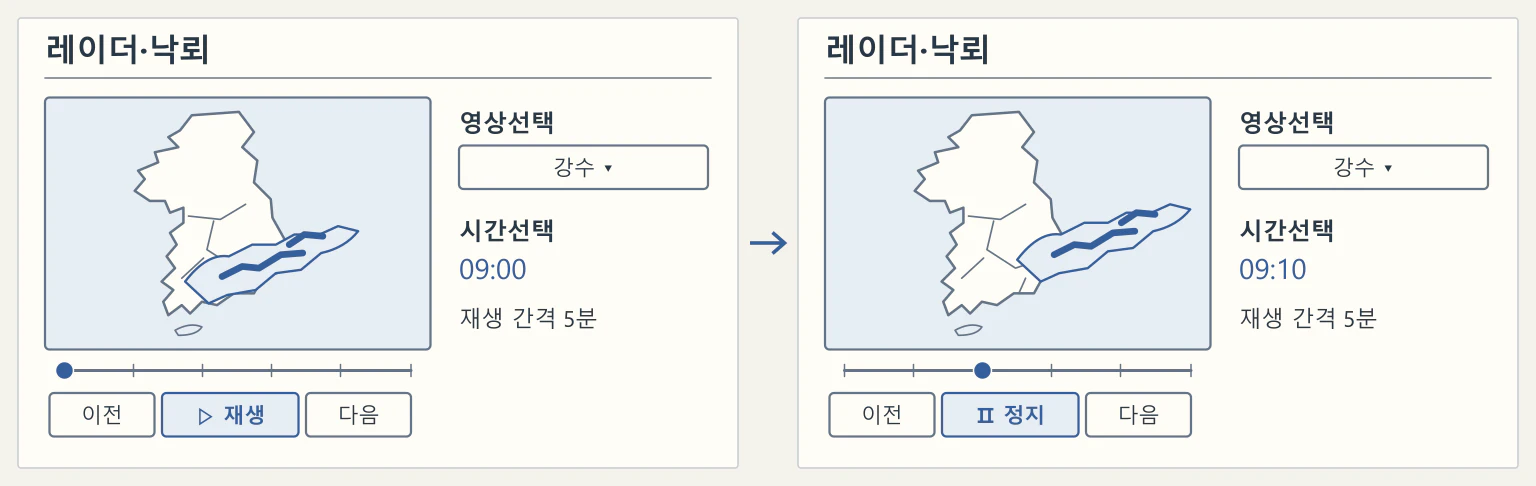
Choose a time interval in Weather Nuri’s radar viewer and press play to see successive observations. Press the same control again to pause on a particular frame.
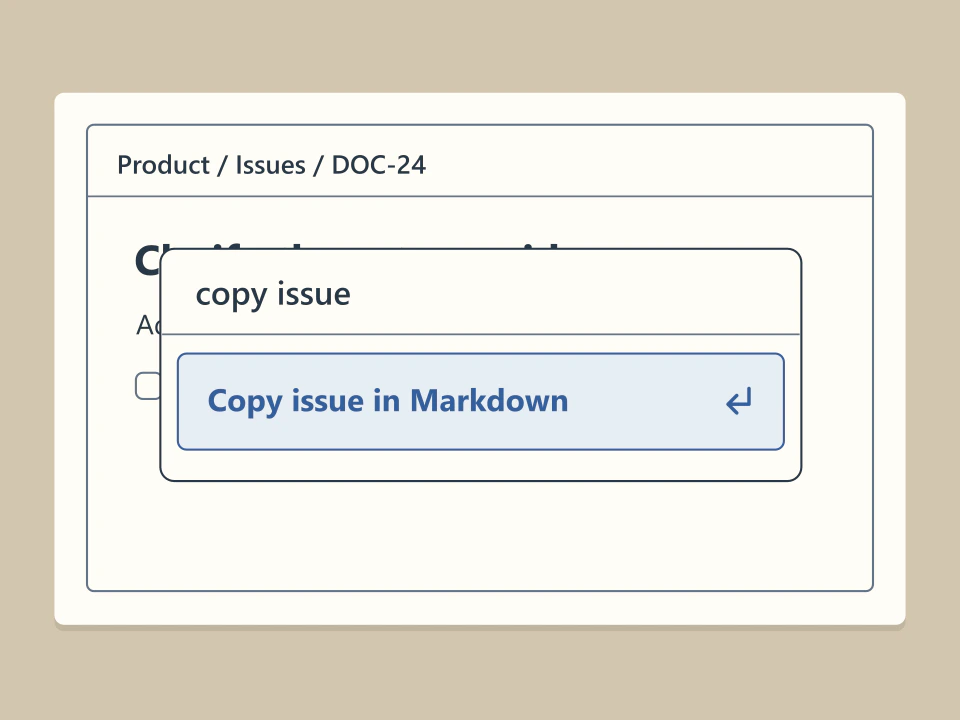
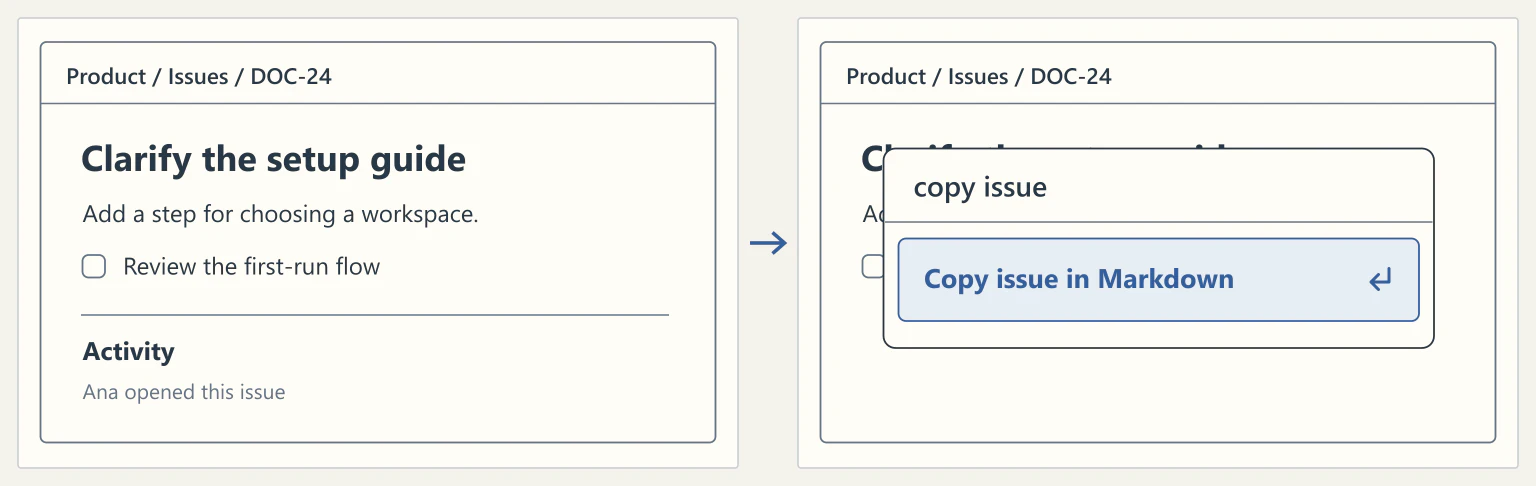
While viewing an issue, press ⌘K or Ctrl+K and choose “Copy issue in Markdown.” The issue description goes to the clipboard as Markdown, ready to paste into another document.
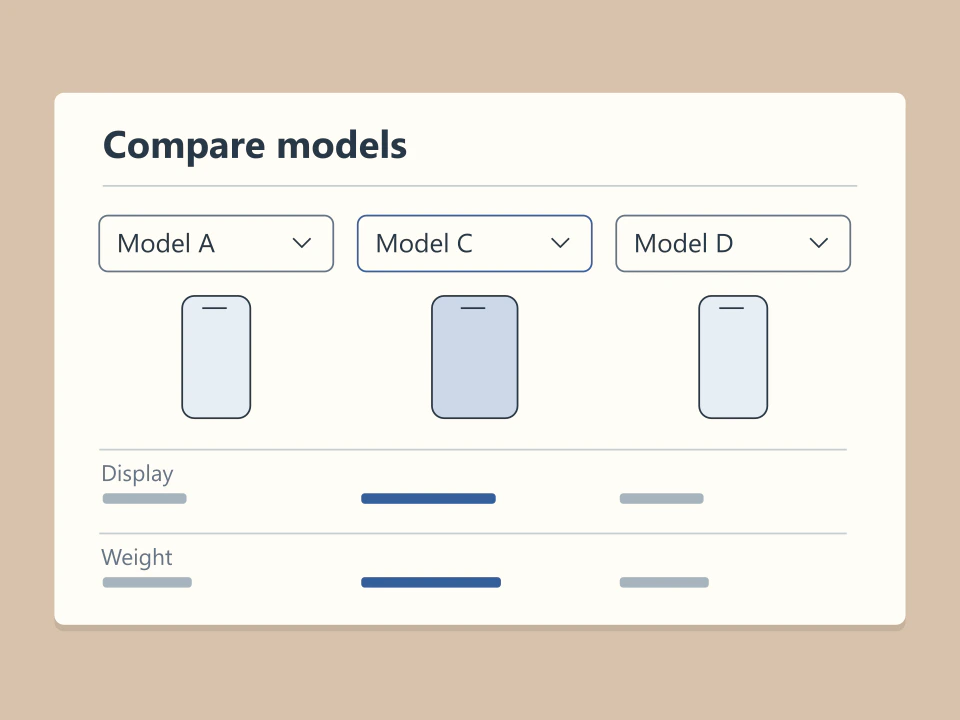
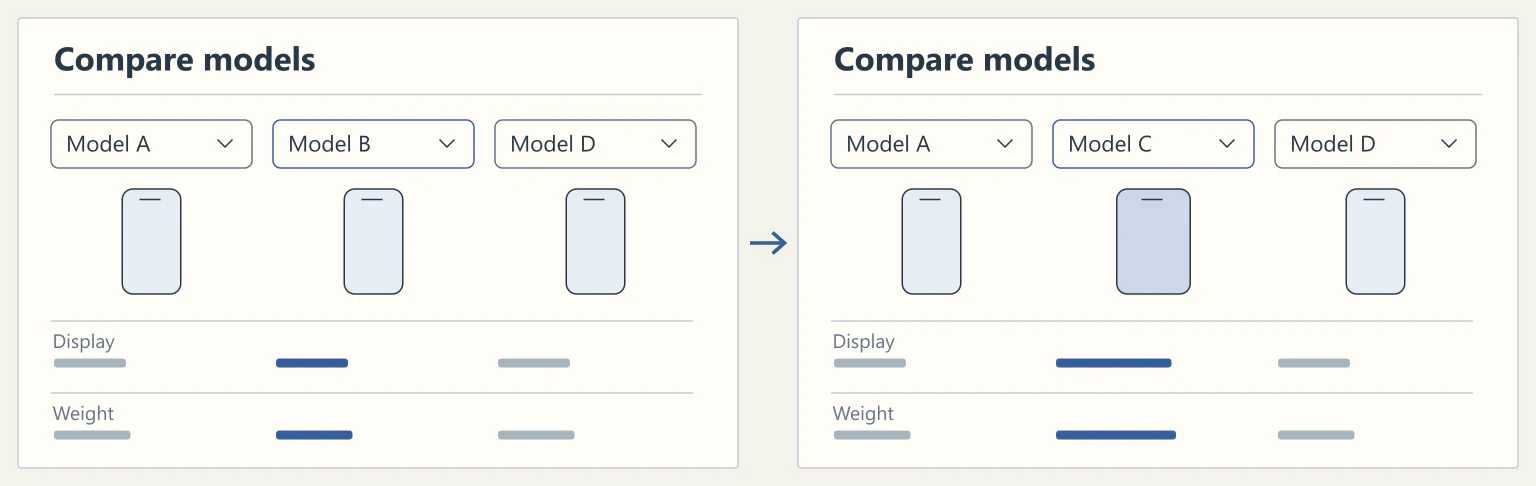
Choose a different iPhone in one column. Its specifications update in place so you can still compare them row by row.
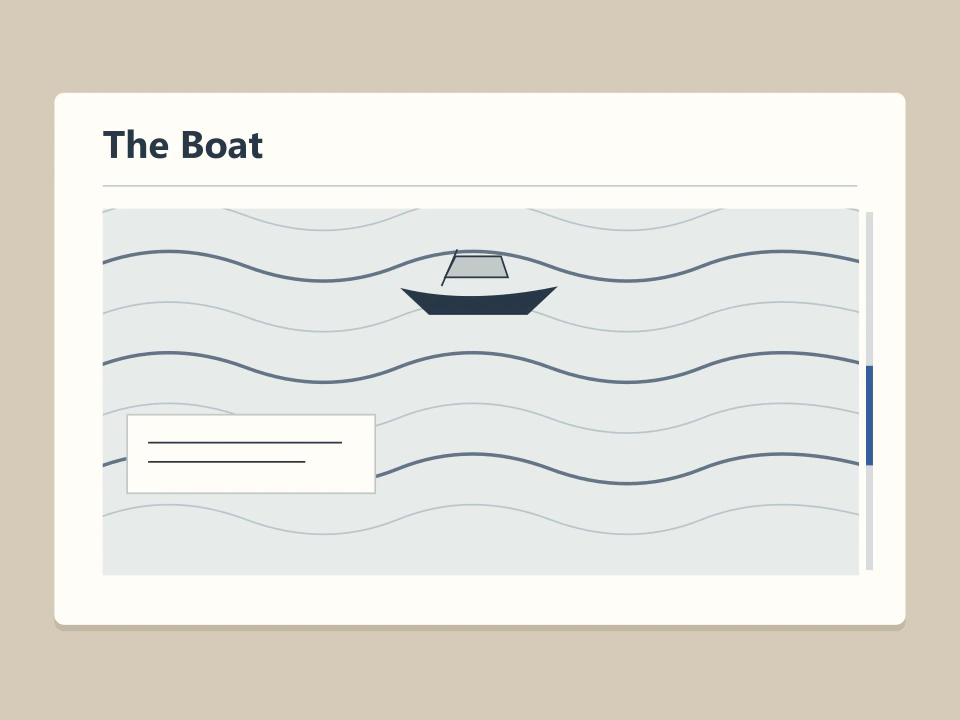
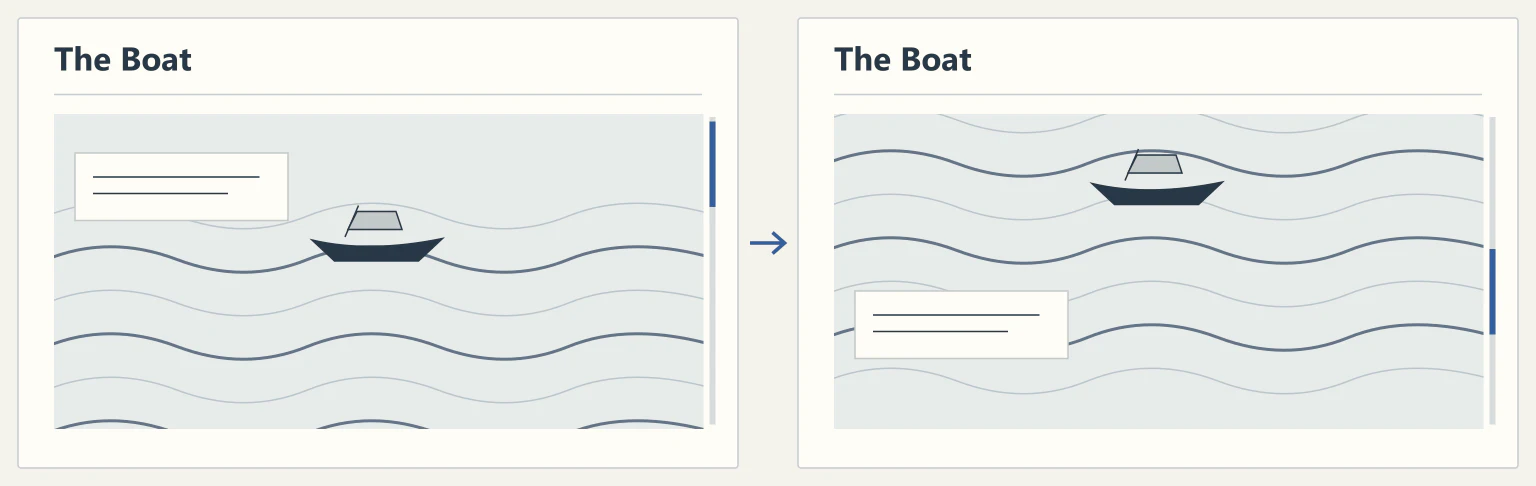
Scroll through The Boat to advance the graphic novel as the text and illustrated layers move at different speeds.
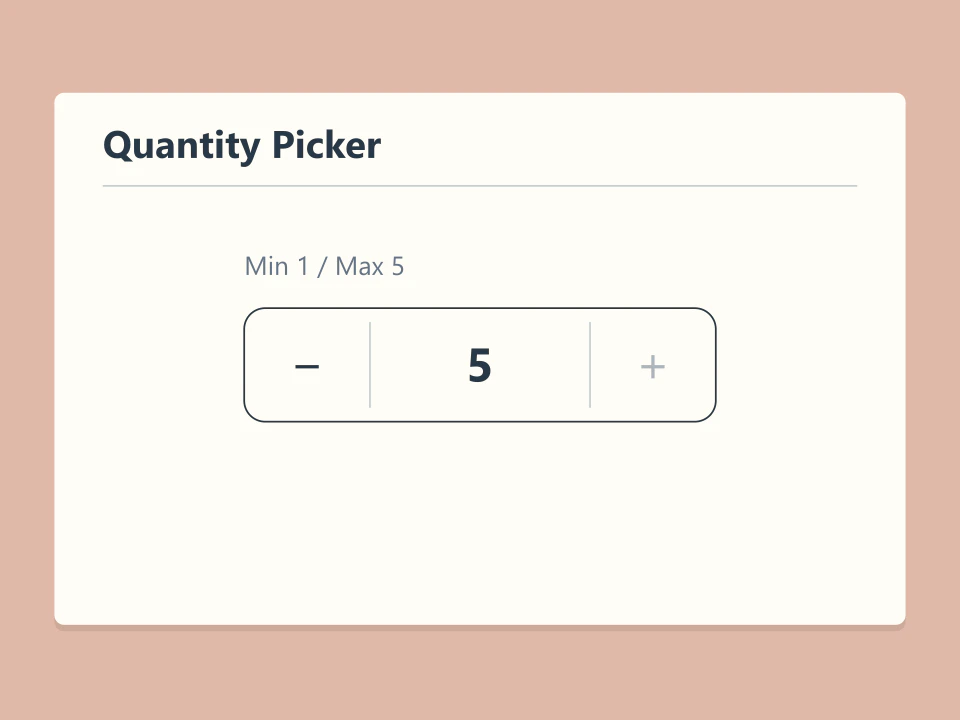
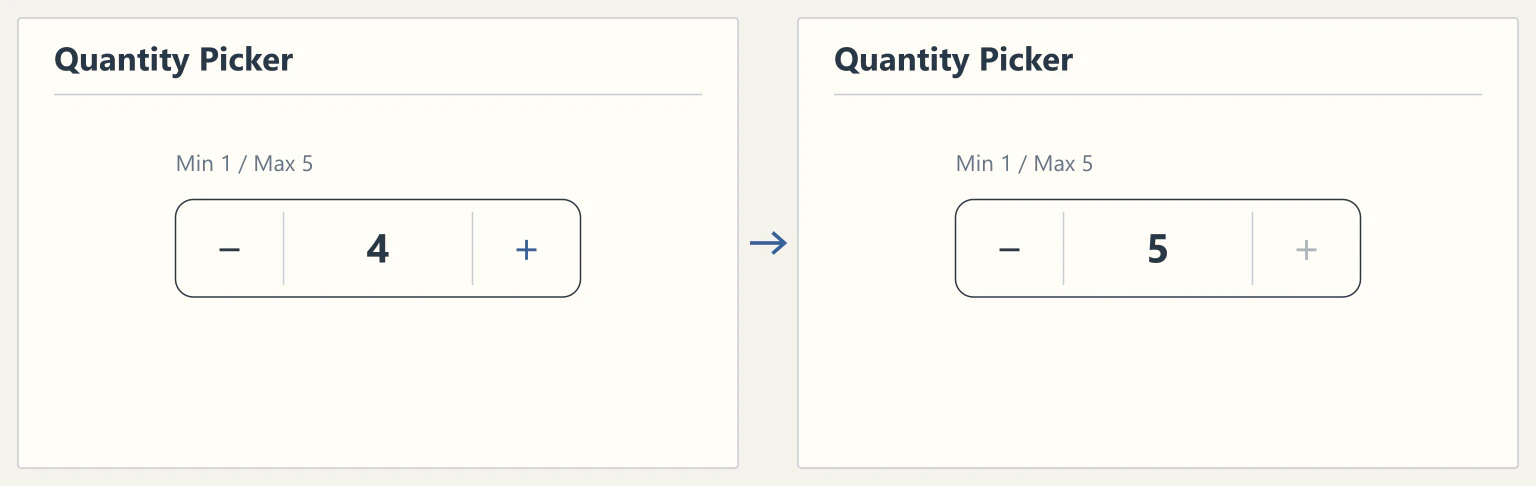
Use the stepper to change the quantity by one. At the configured maximum, the plus button is disabled.
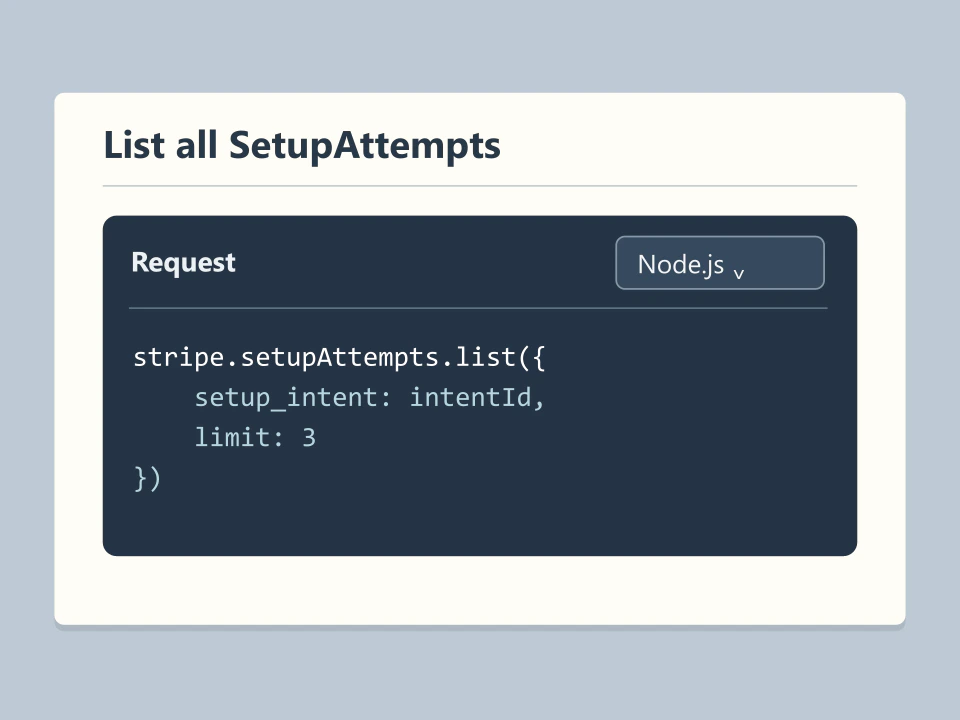
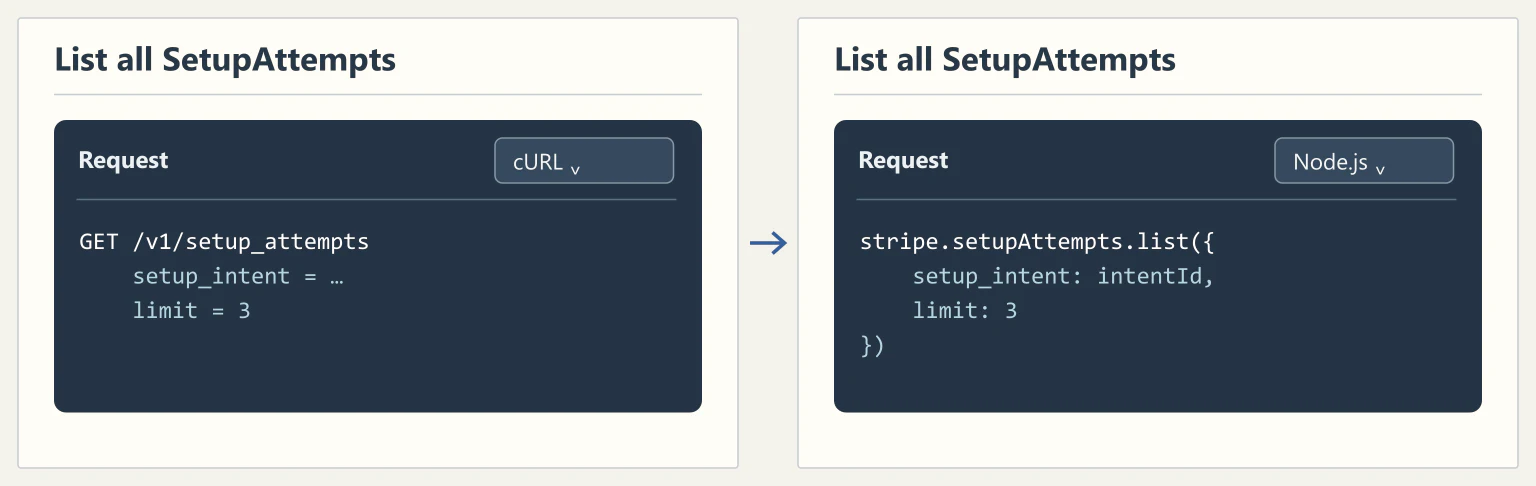
Switch languages in the SetupAttempts API reference to see the same request in another language.
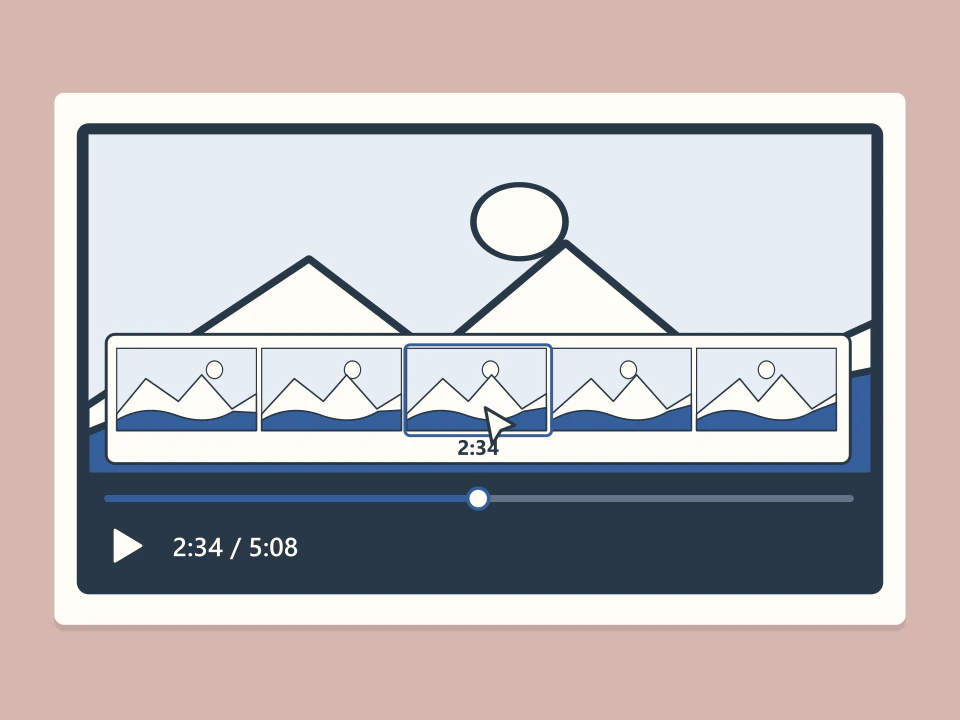
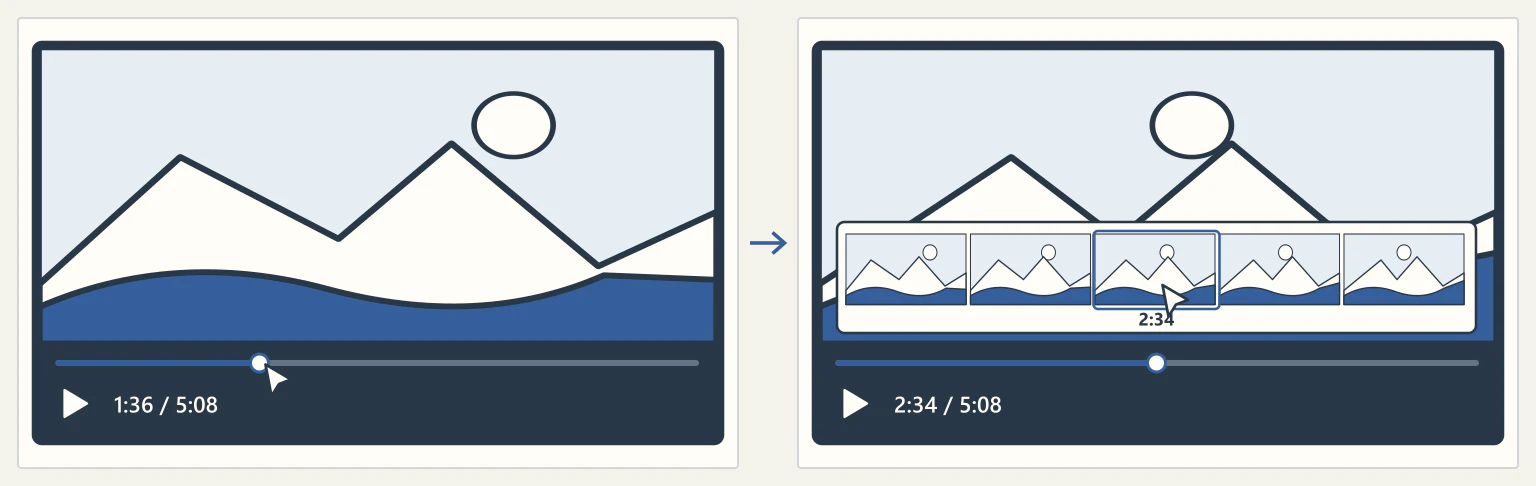
On the desktop player, pull the red playhead upward to open a strip of thumbnails. Drag through the strip to choose a scene, then press Play to watch from there.
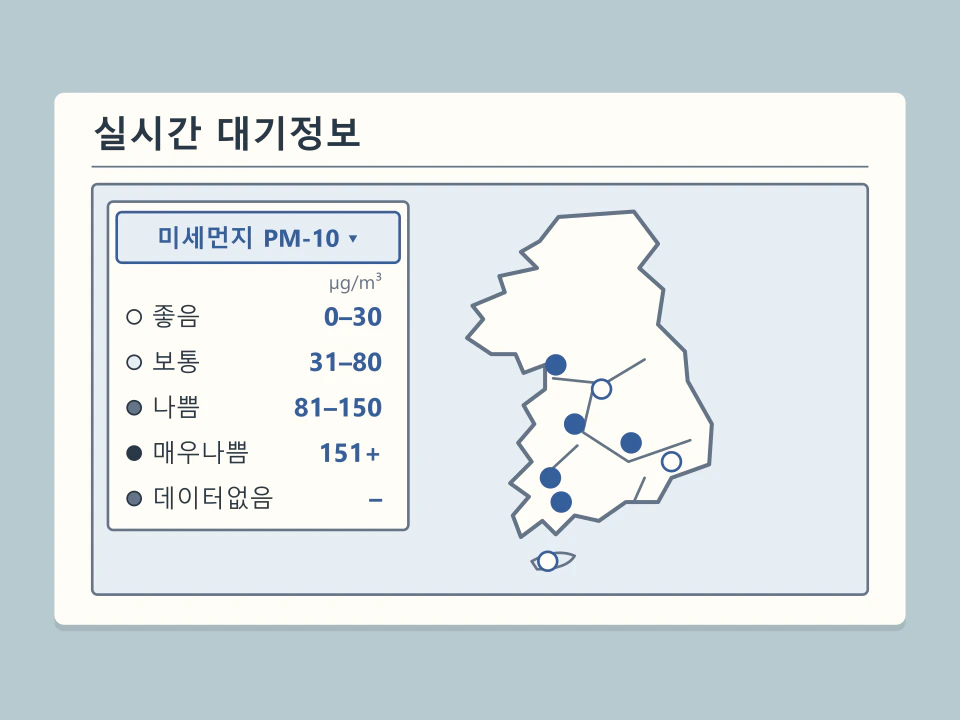
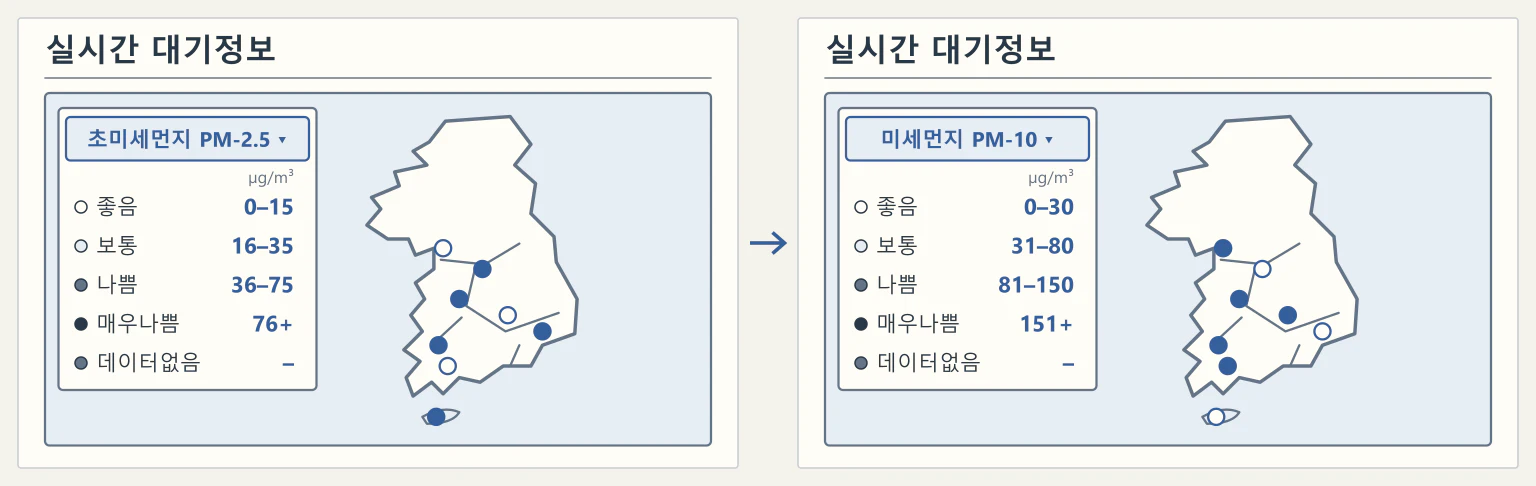
Switch between PM2.5 and PM10 on the live air quality map. The legend updates its concentration thresholds for each air quality band to match the selected pollutant.
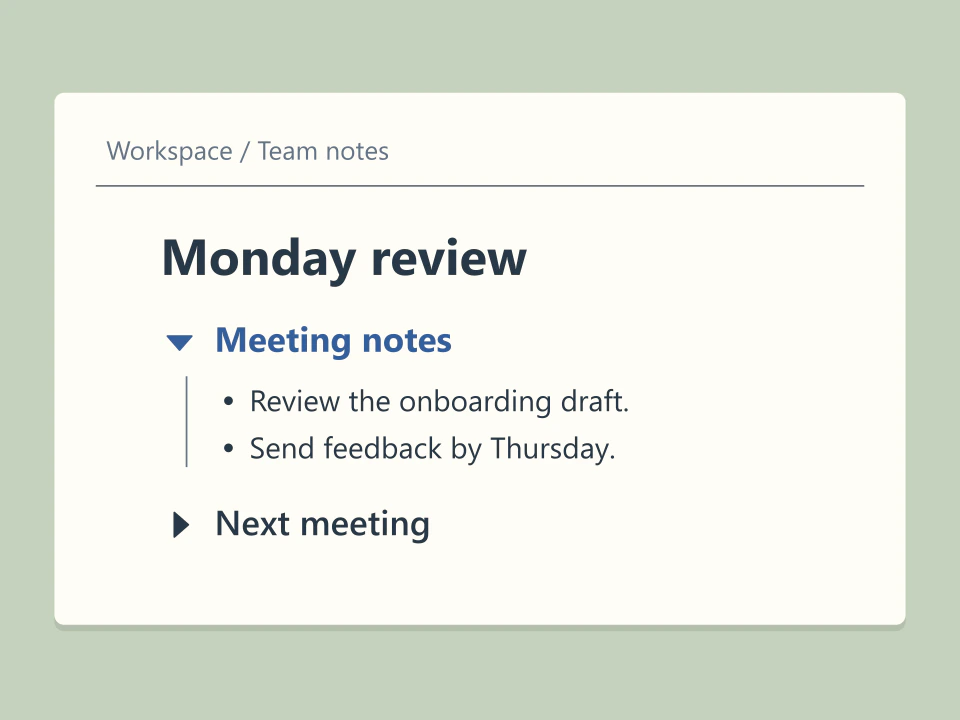
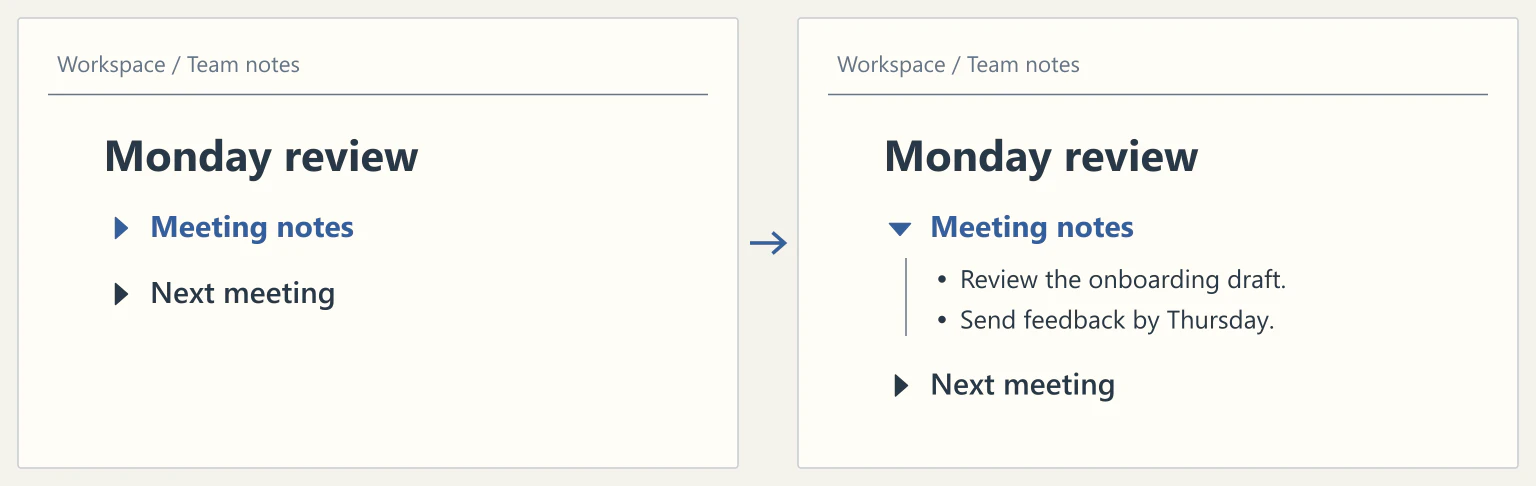
On a new line, type > followed by a space to create a toggle. Put the meeting notes inside it so readers can expand the item when they need the detail, then collapse it again.
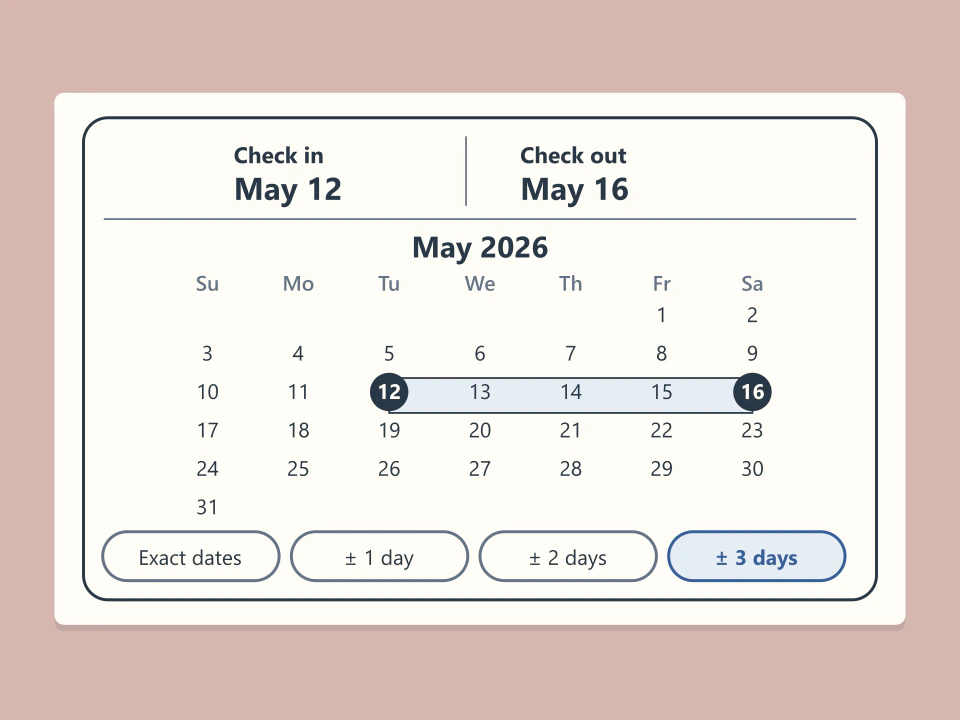
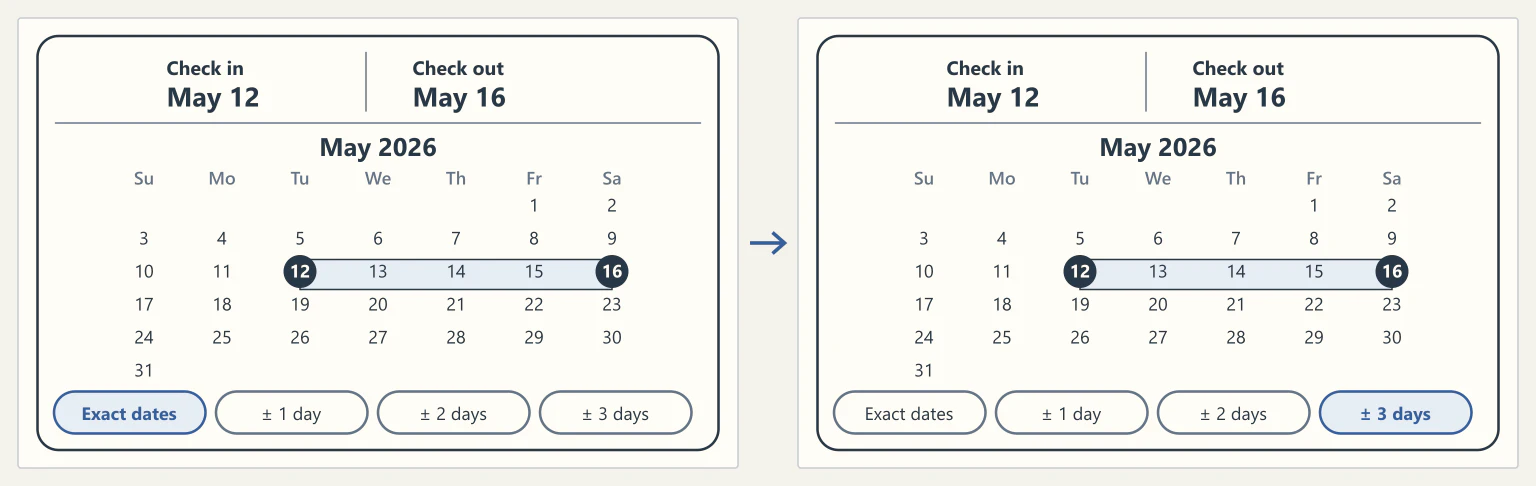
Enter check-in and checkout dates, then choose how much the dates can move. A three-day margin on either side also surfaces places available close to the original dates.
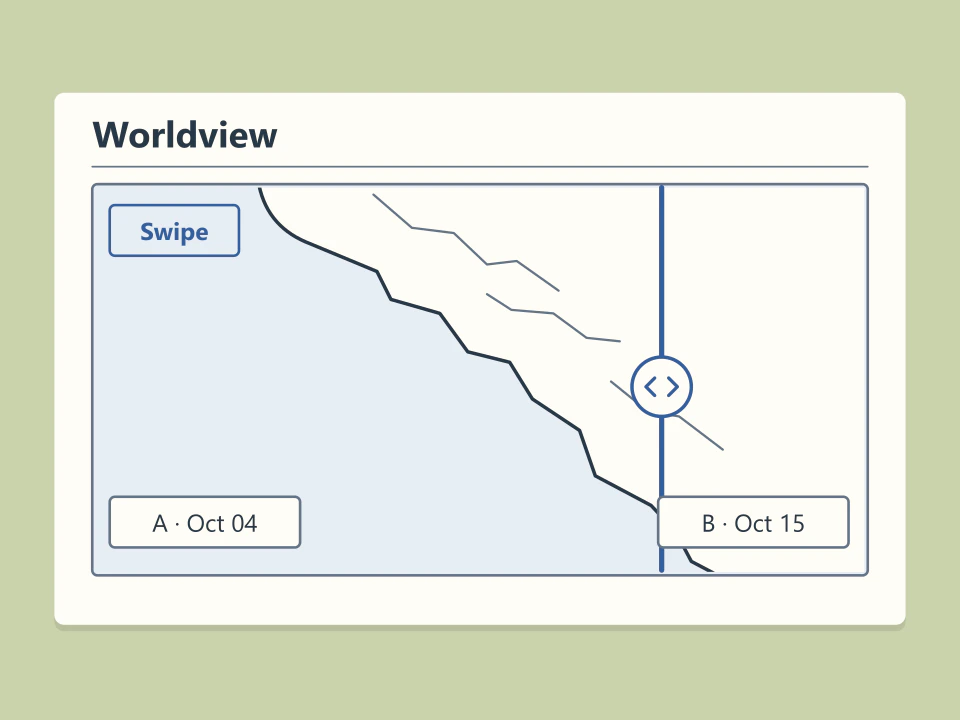
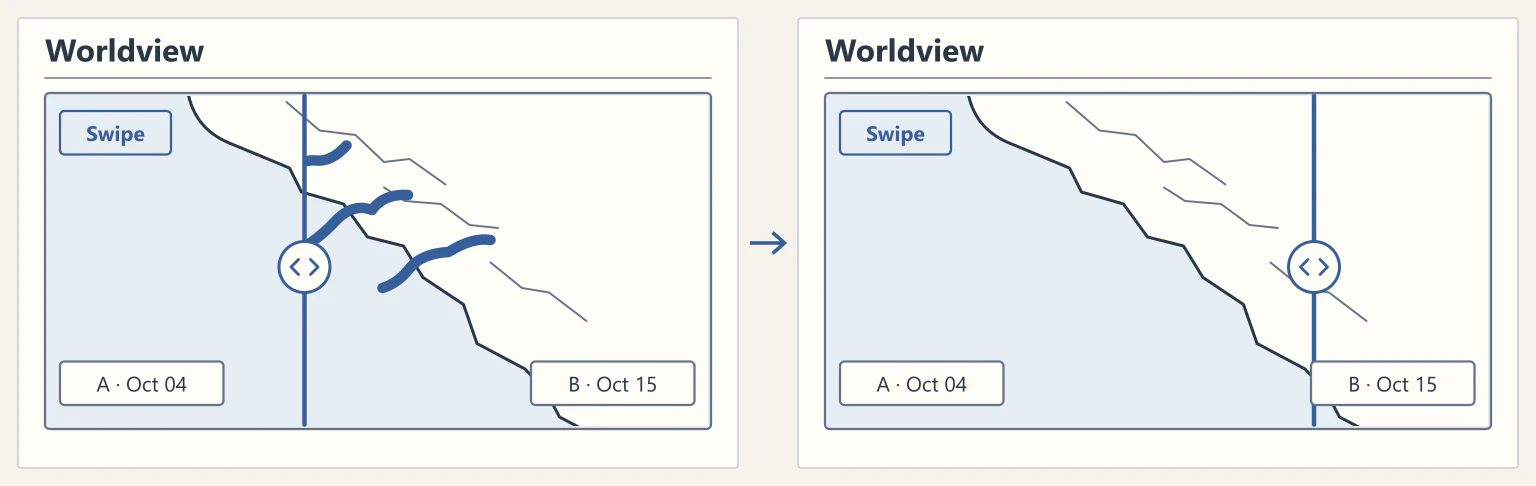
In Worldview’s comparison mode, set the two views of one area to different dates. Drag the Swipe divider sideways to reveal more of either observation without moving the map.
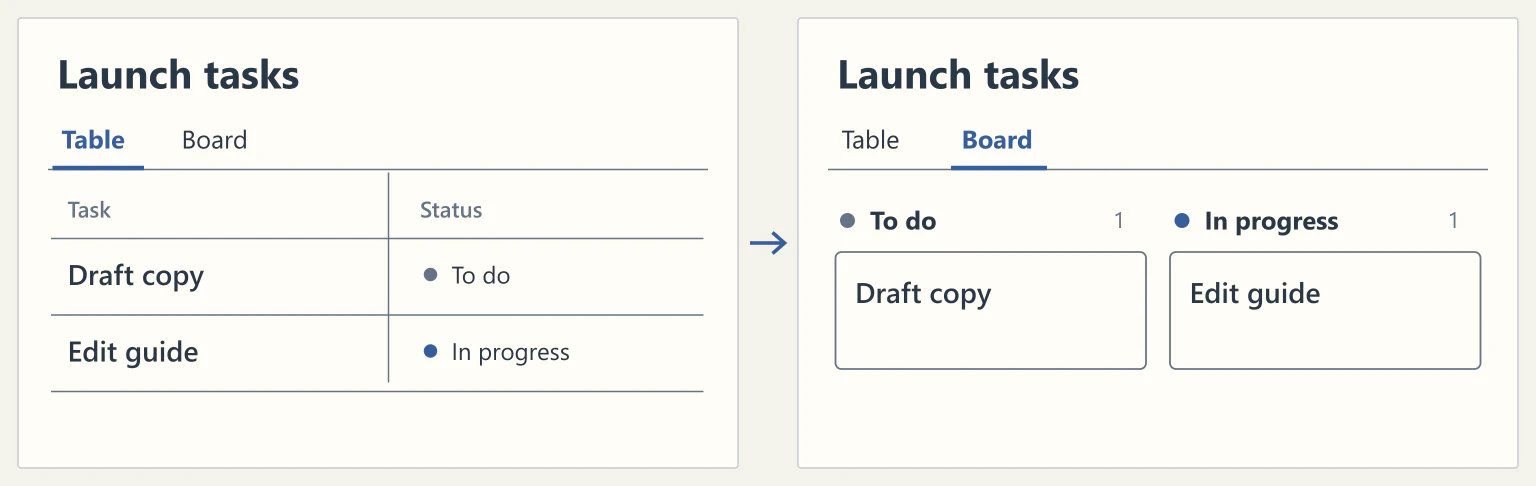
Set up table and board views for one task database, then select a view tab. The table shows task properties in columns, while a board grouped by status puts the same tasks into lanes.
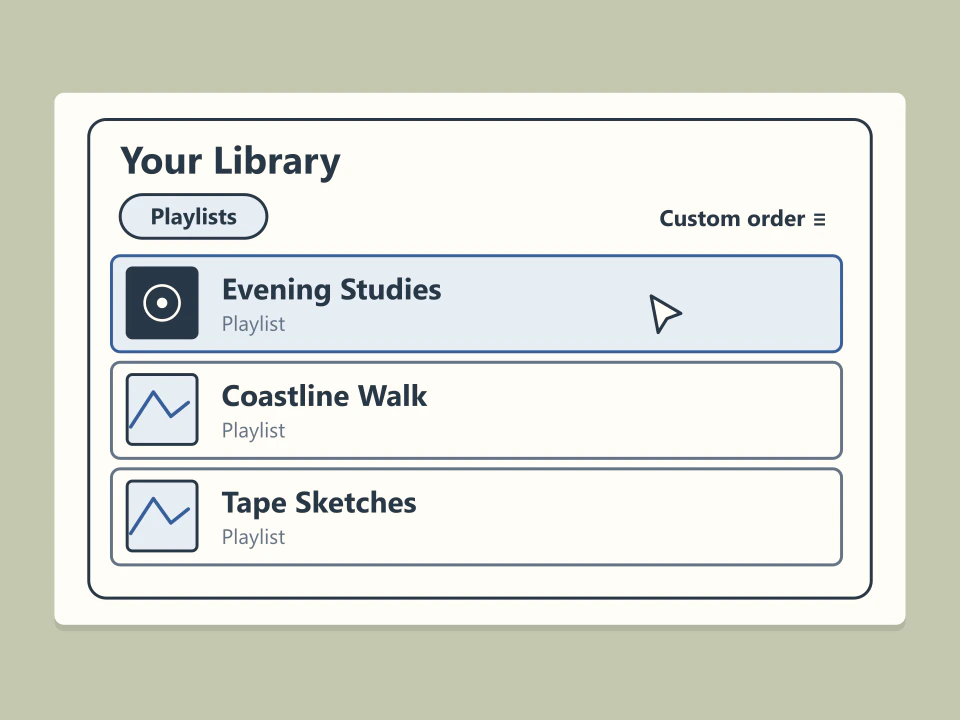
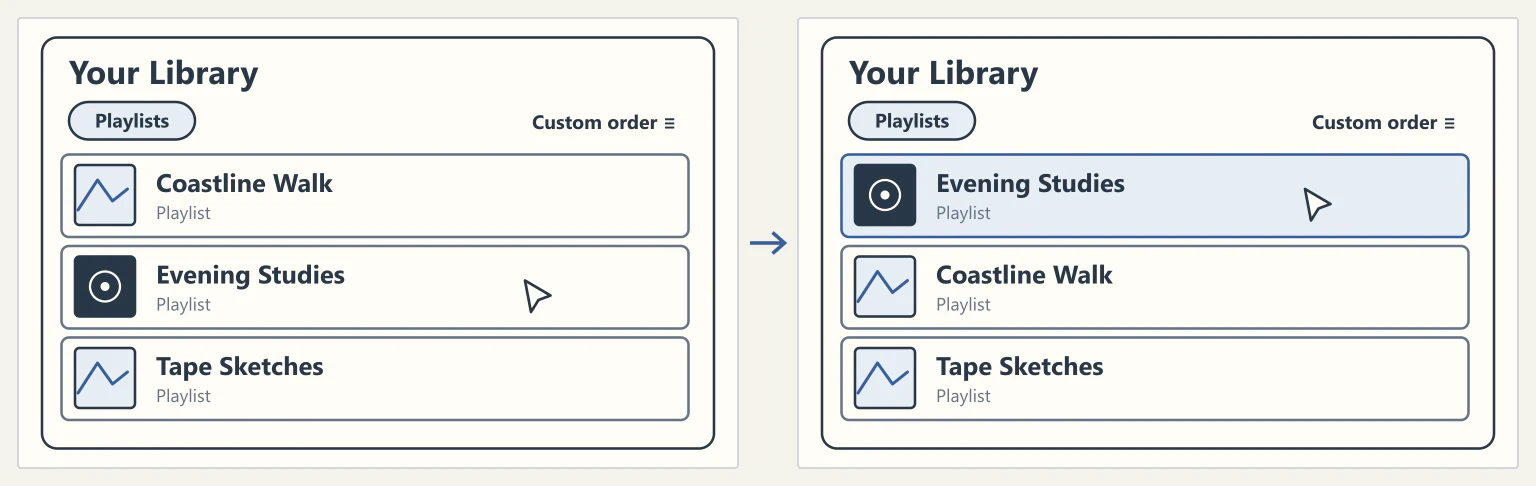
In the desktop library, filter to playlists and choose custom order. Drag a playlist to its new position and the same order appears on your other devices.
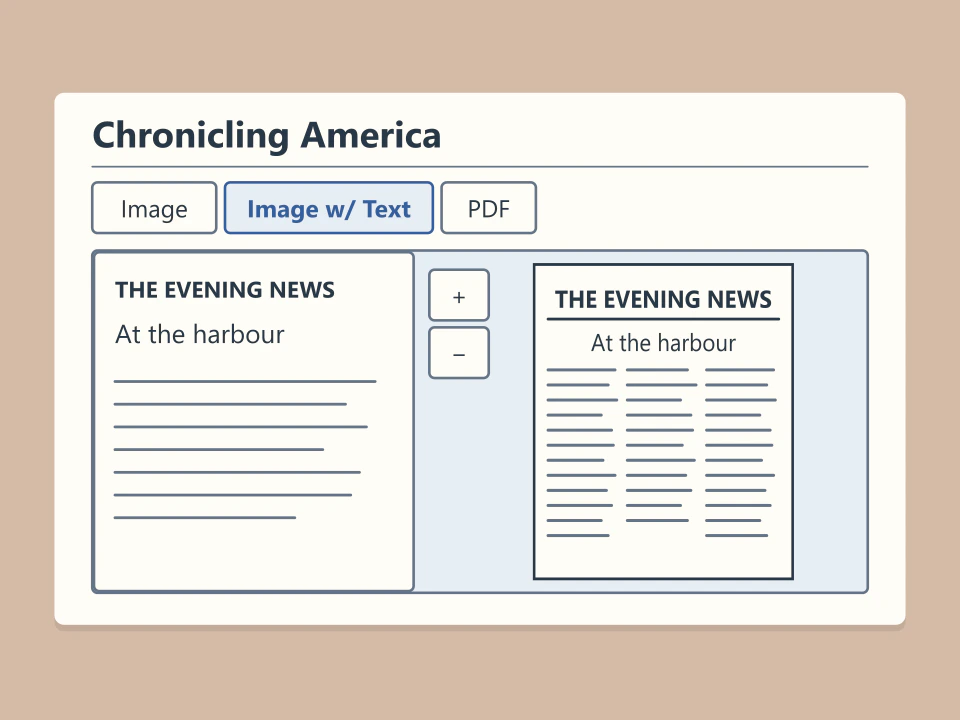
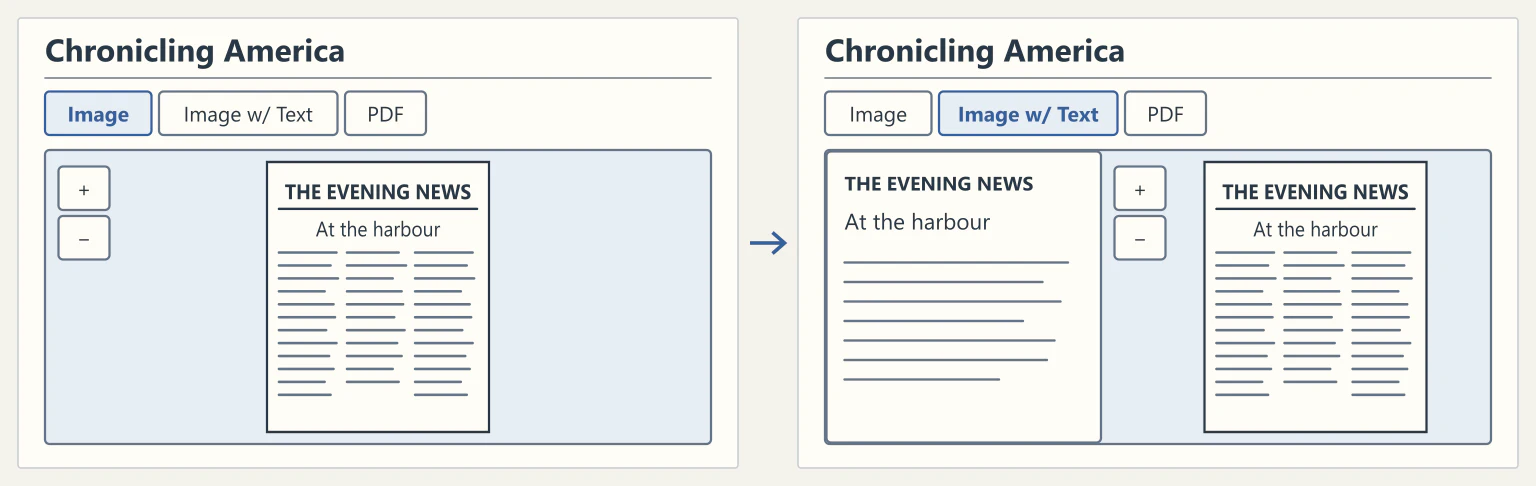
Open a page in Chronicling America and select “Image w/Text.” The machine-read text appears to the left of the scan so you can check a reading against the original print.
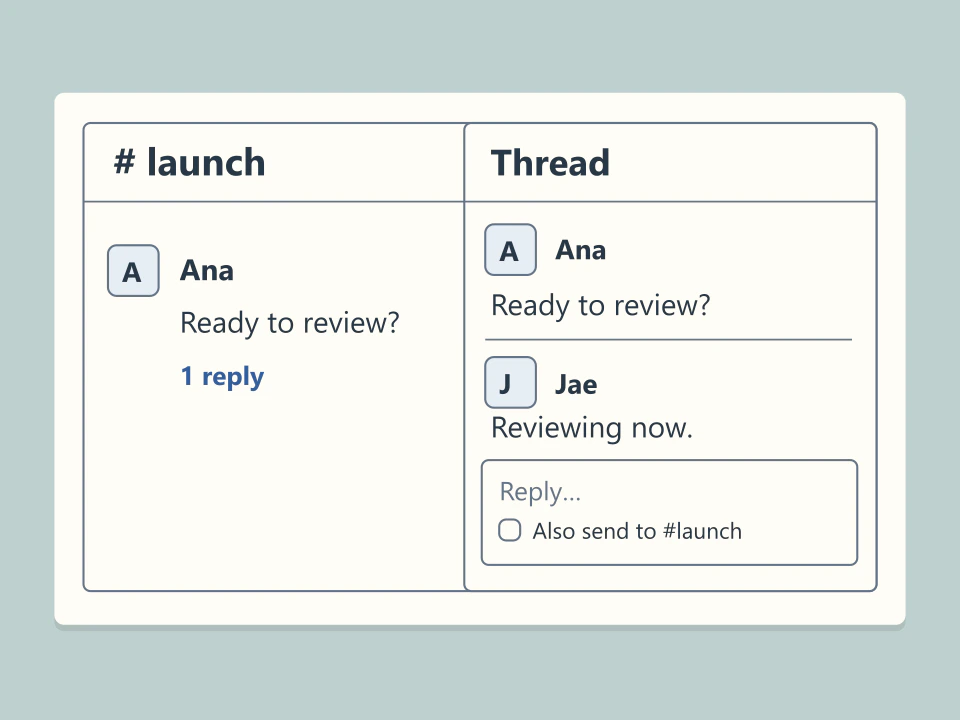
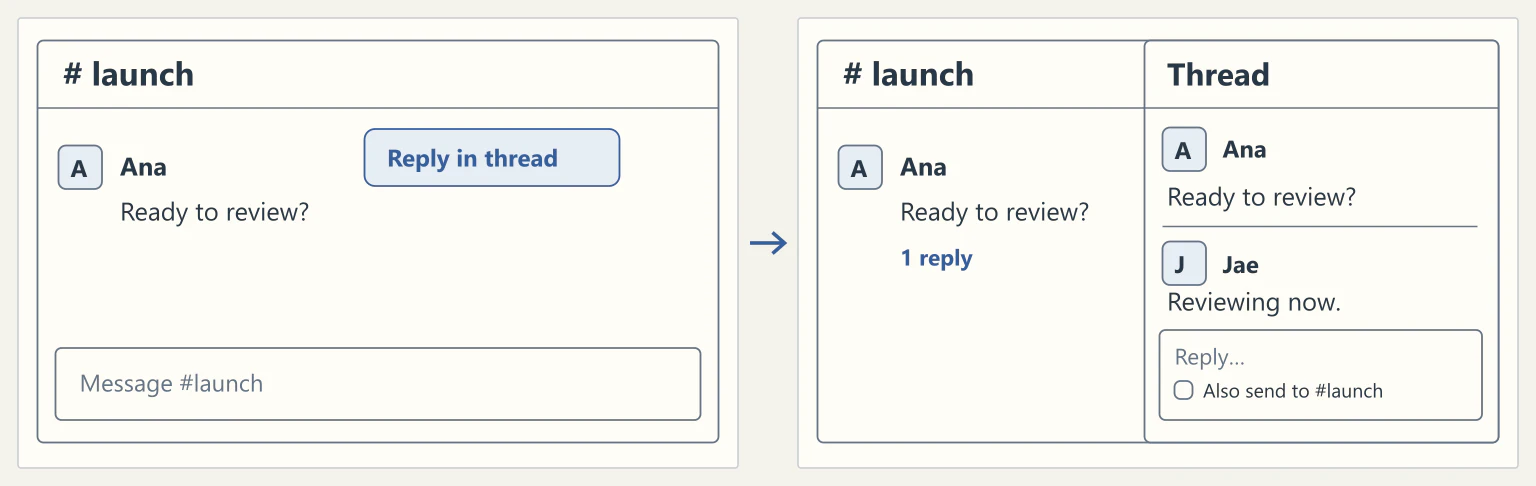
On desktop, hover over a message and open its thread to reply. Replies stay together under that message, with a checkbox for sending a particular reply to the channel as well.
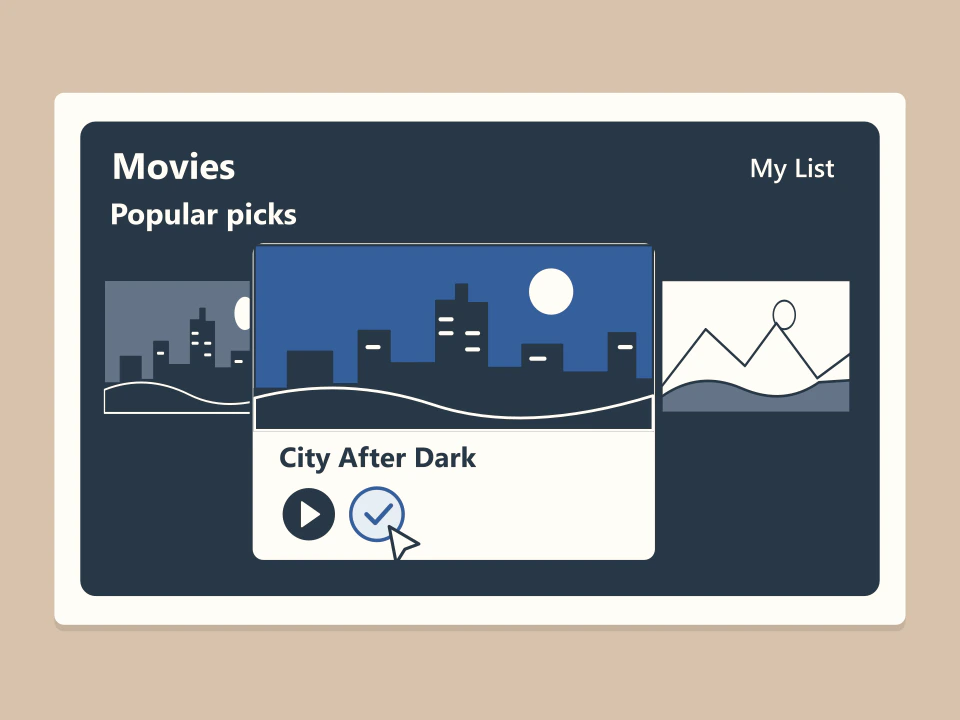
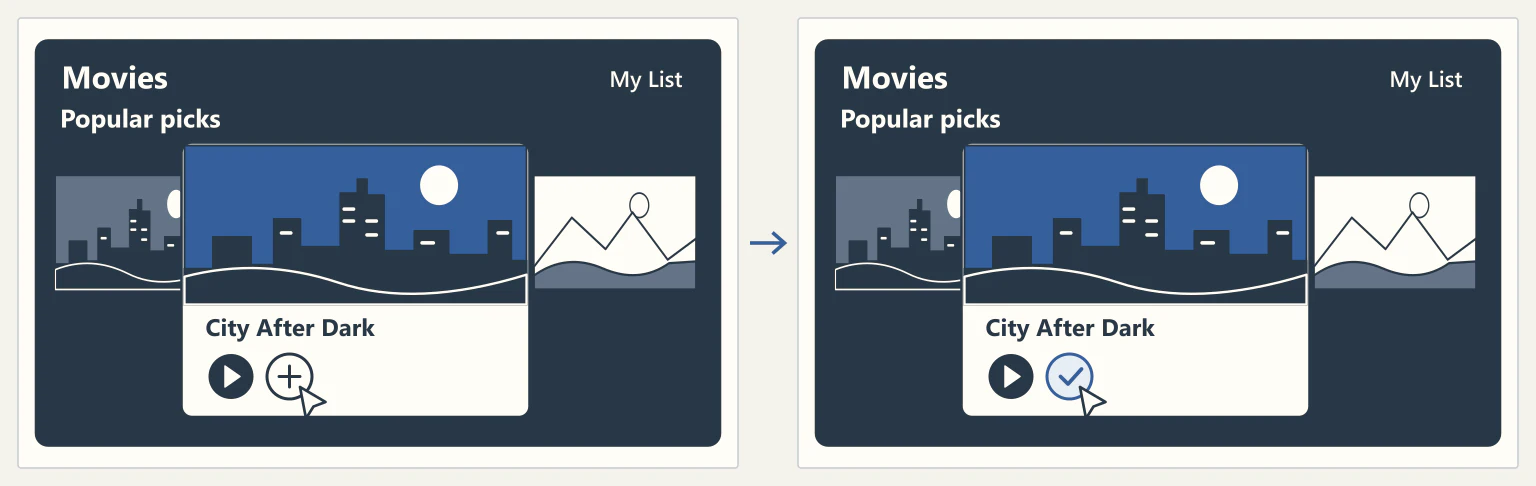
Hover over a film or series in the browser and click the plus icon to add it to My List. On a saved title, the checkmark in the same control lets you remove it.
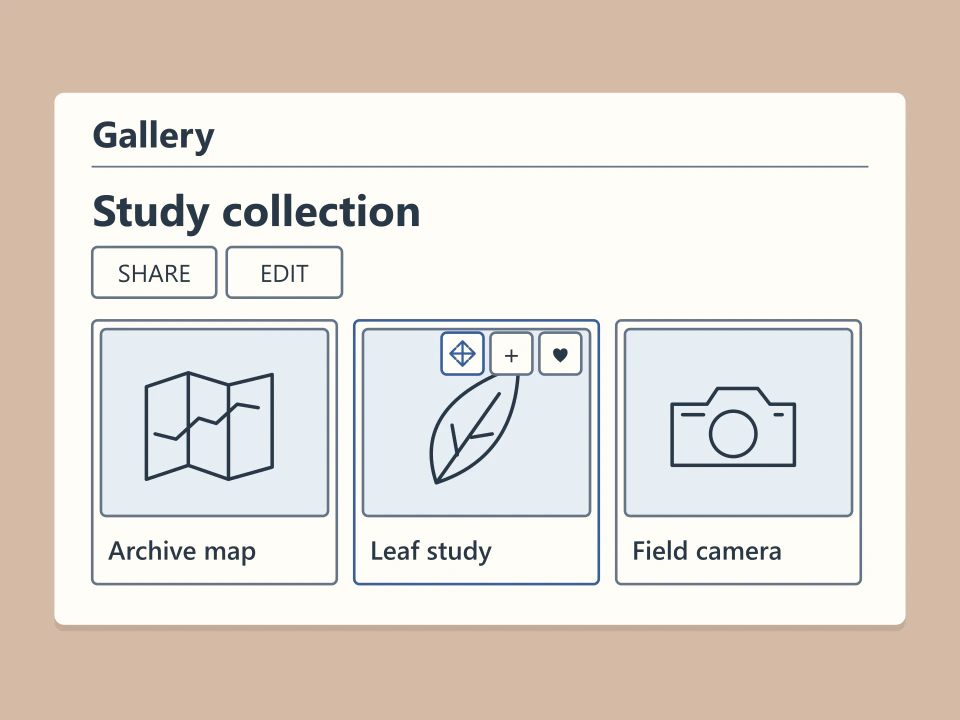
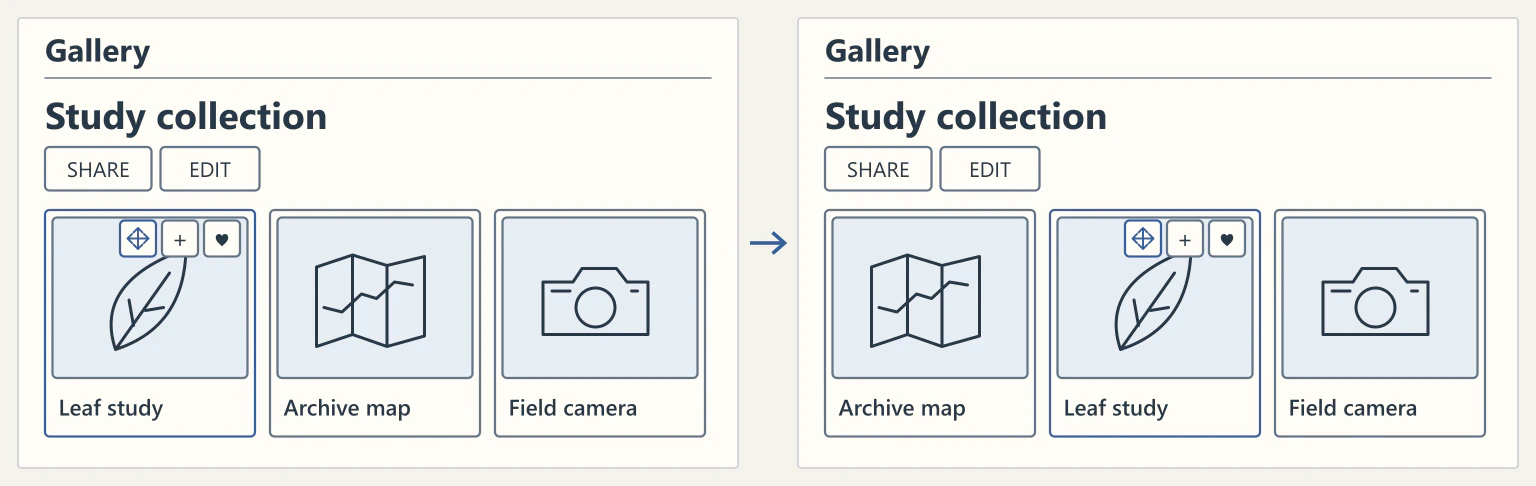
Sign in and open one of your galleries on desktop. Hover over an item to reveal its arrow handle, then drag it to a new position to change the display order.
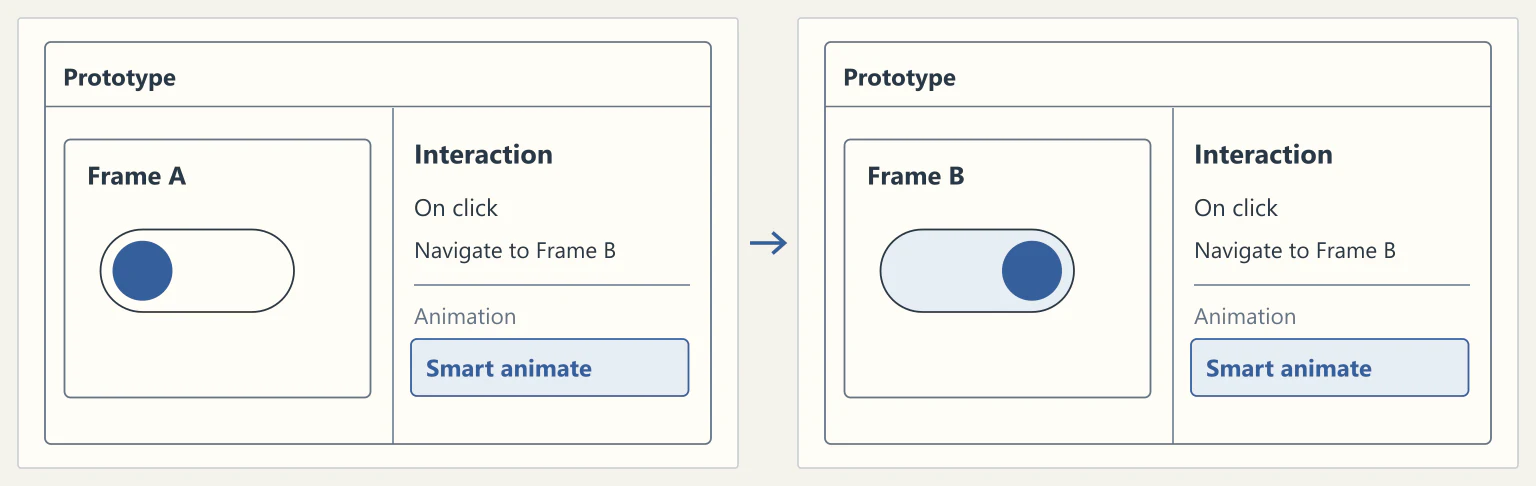
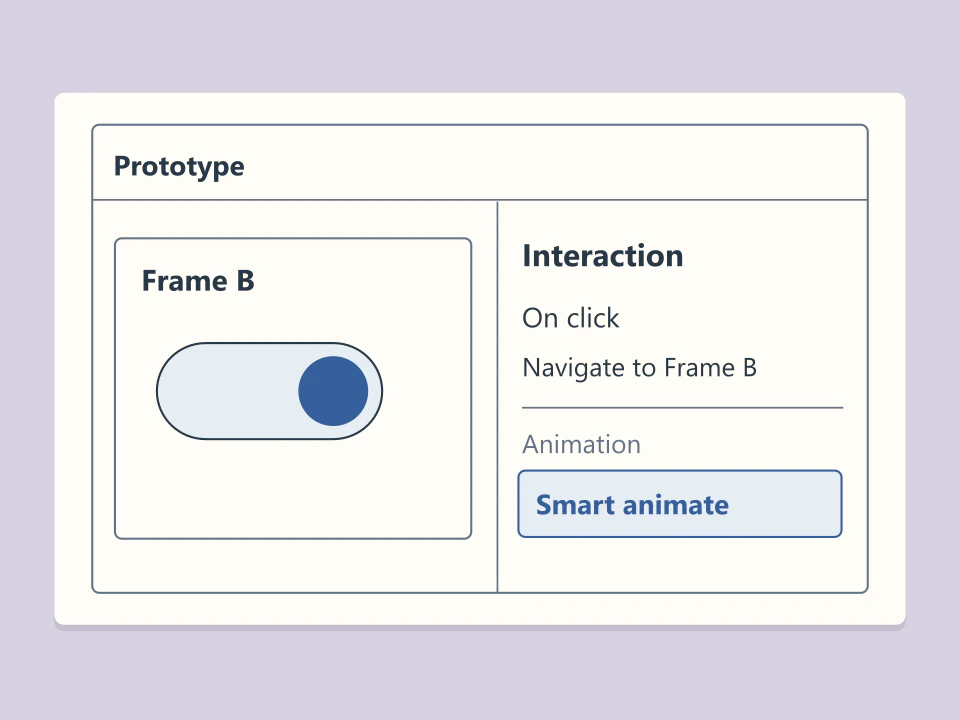
Give the corresponding layers the same name and hierarchy in both frames, then choose Smart animate for the transition. If the element sits elsewhere in the second frame, the prototype shows it moving from its original position.
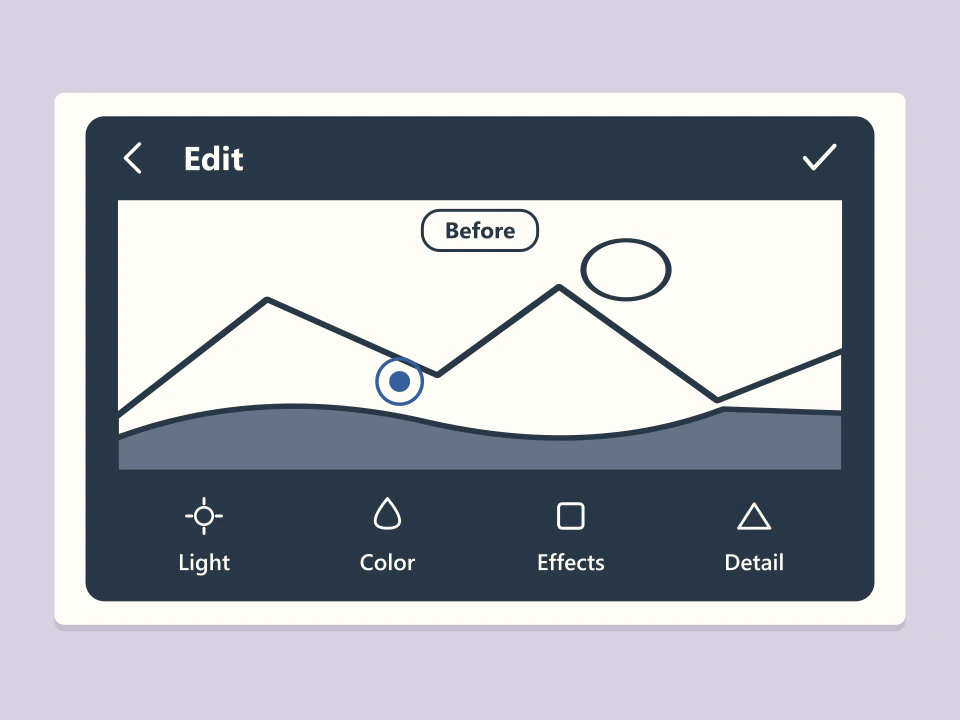
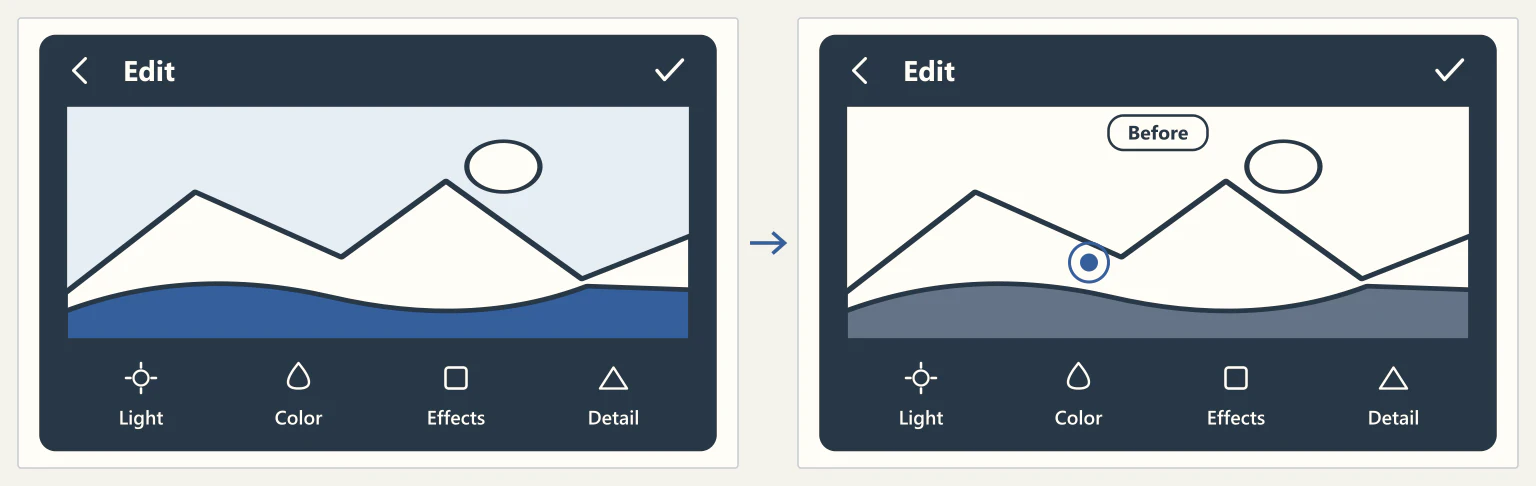
In the mobile editor, press and hold the photo to see it before your edits. Lift your finger to return to the edited view and compare color and brightness in place.
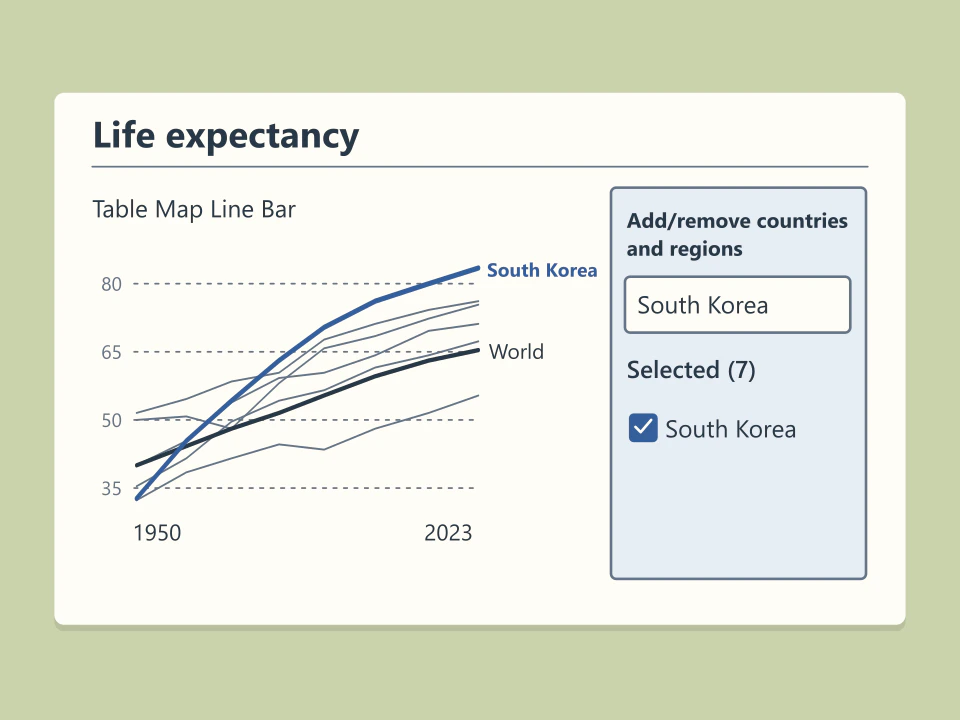
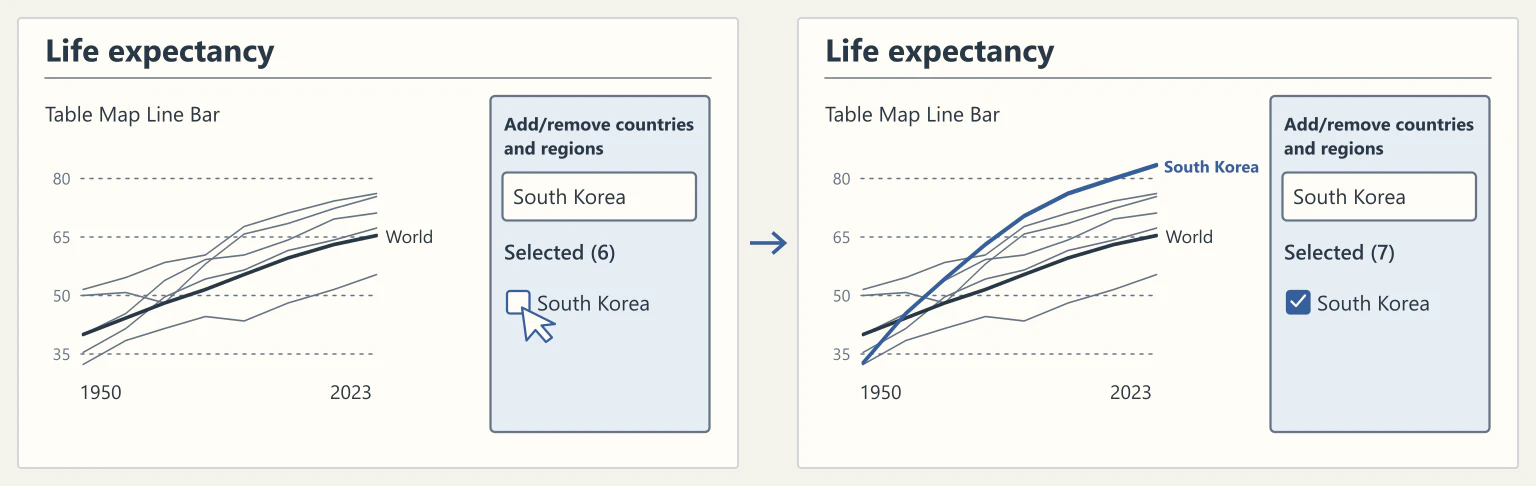
Search for a country or region in the life expectancy chart’s selector and add it to plot its trend alongside the others. Deselect it to remove just that series.
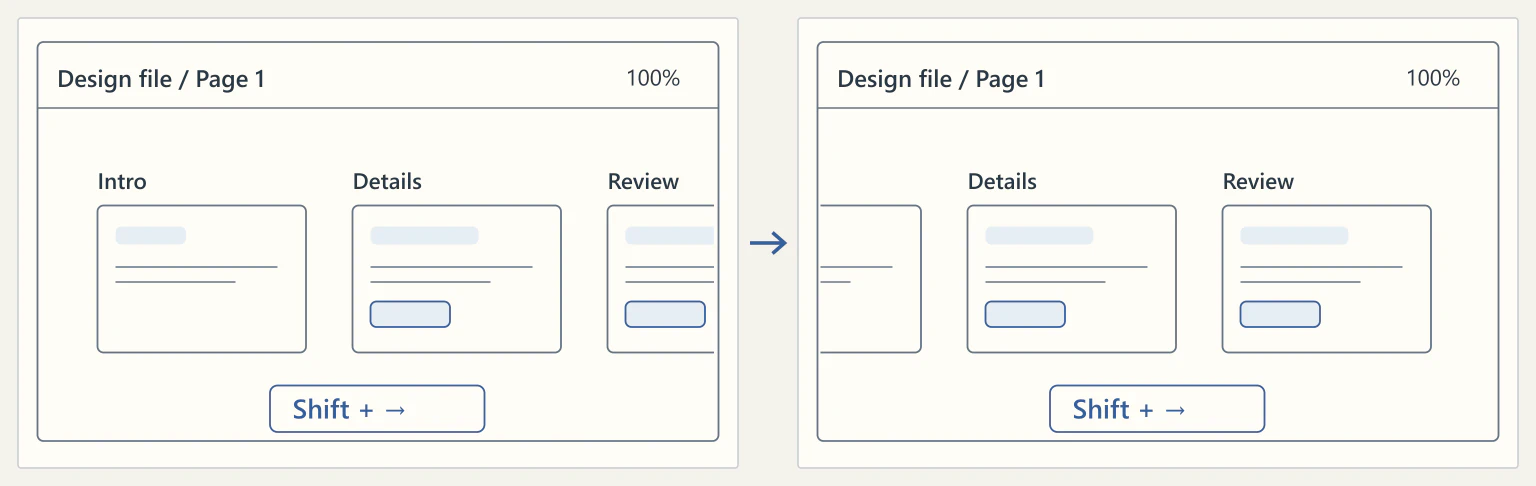
With nothing selected, use the arrow keys to move around the canvas. Hold Shift to cover more ground, or use ⌘ or Ctrl with + and − to change the zoom level.
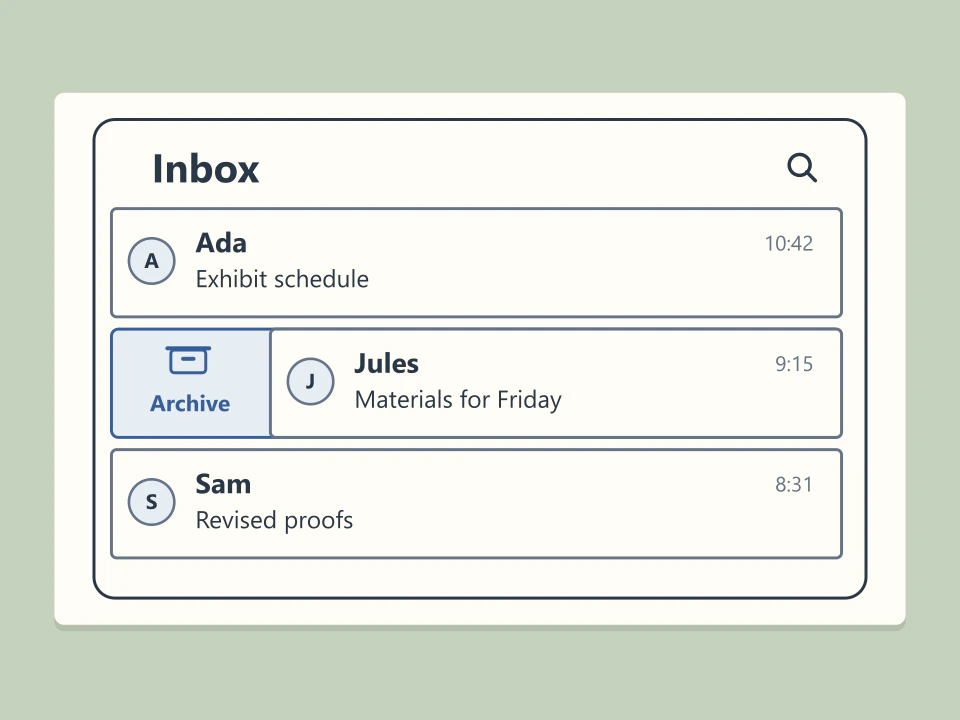
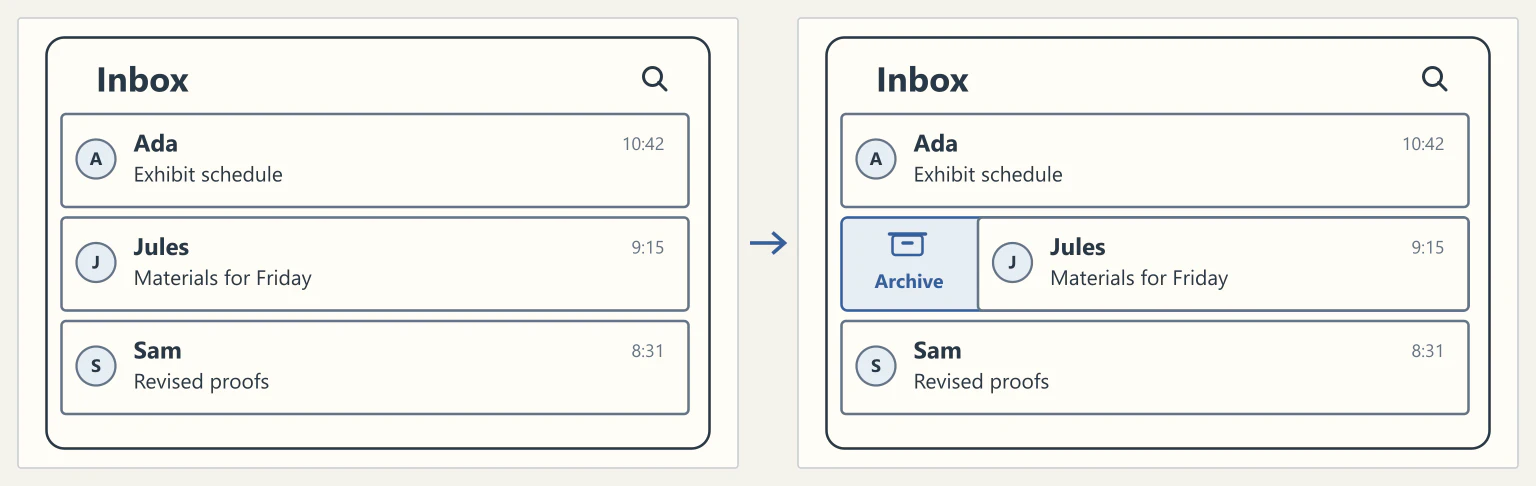
In the mobile message list, the default right swipe archives a message and the left swipe deletes it. Settings let you assign different actions to short and long swipes in either direction.
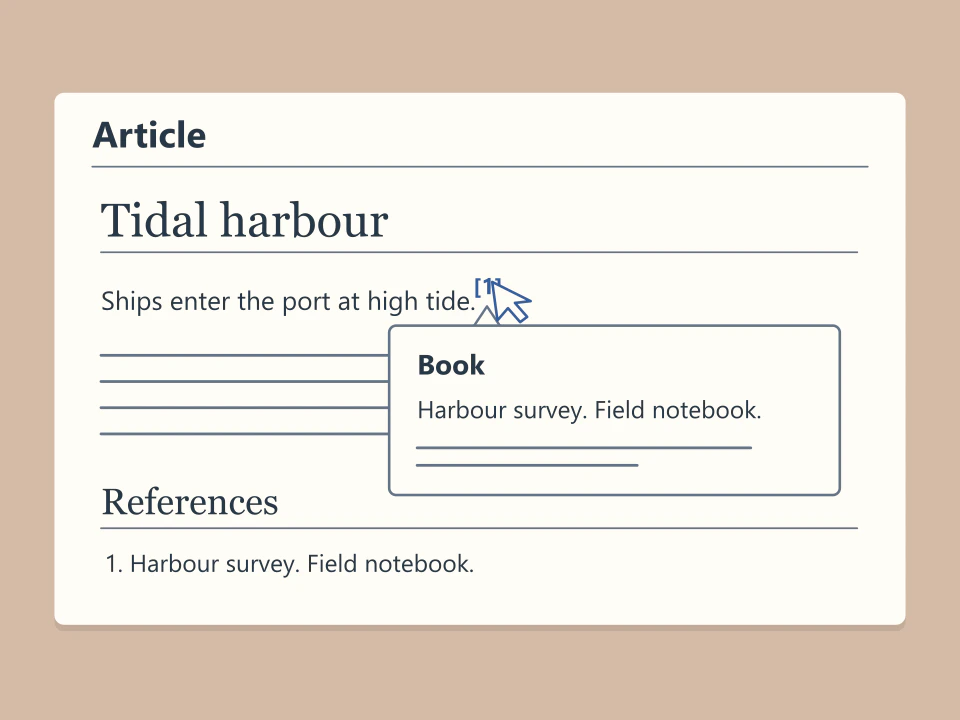
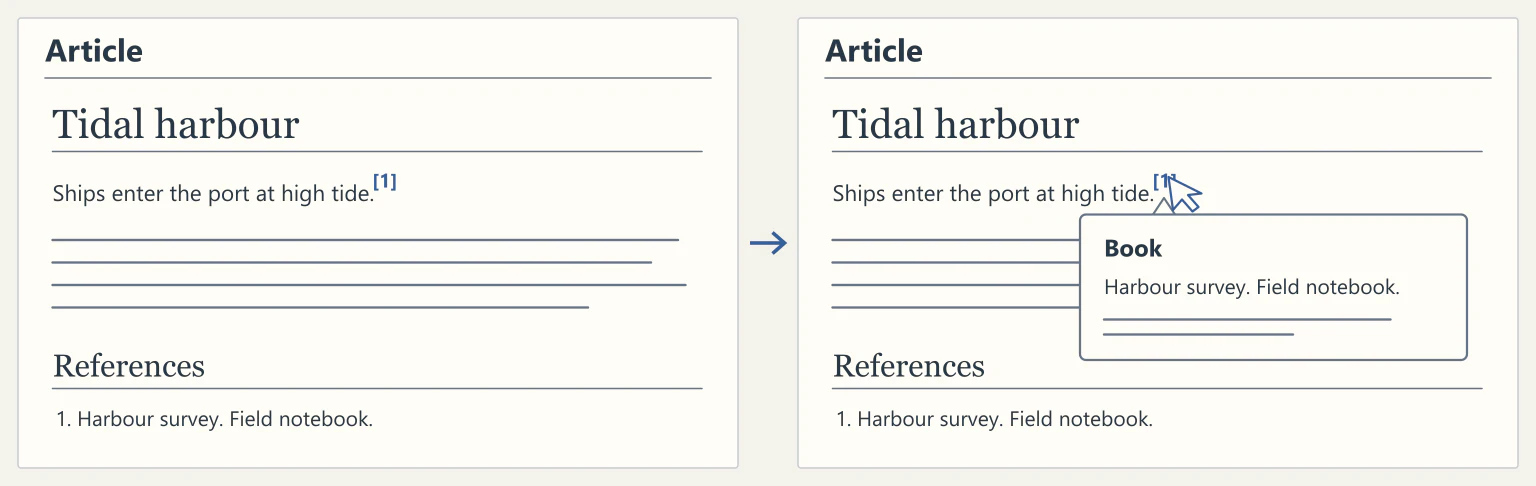
With reference previews enabled, hovering over a footnote marker opens its citation beside the text. Long notes scroll inside the preview while the article stays in place.
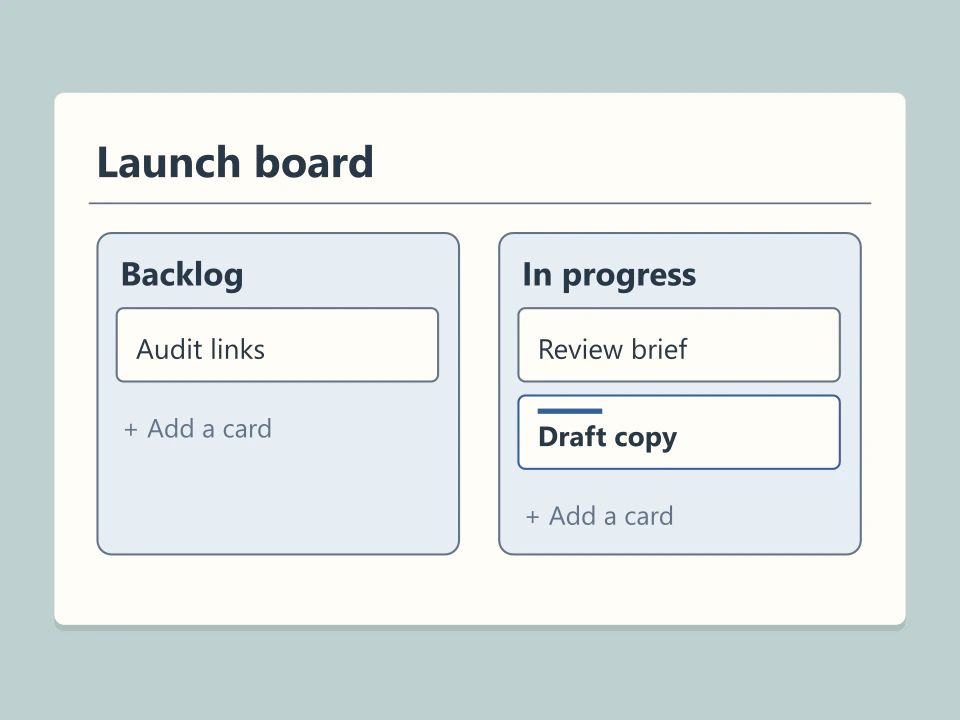
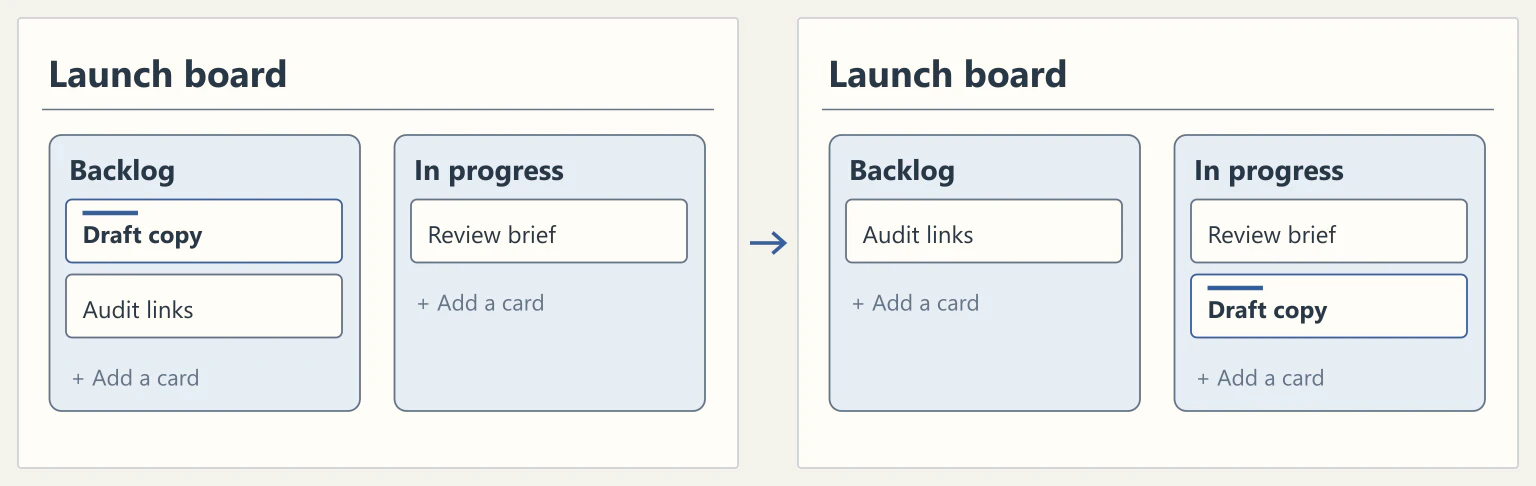
Drag a card up or down its current list to change the order of work. Dropping it in another list moves it there, useful when a task goes from a backlog into progress.
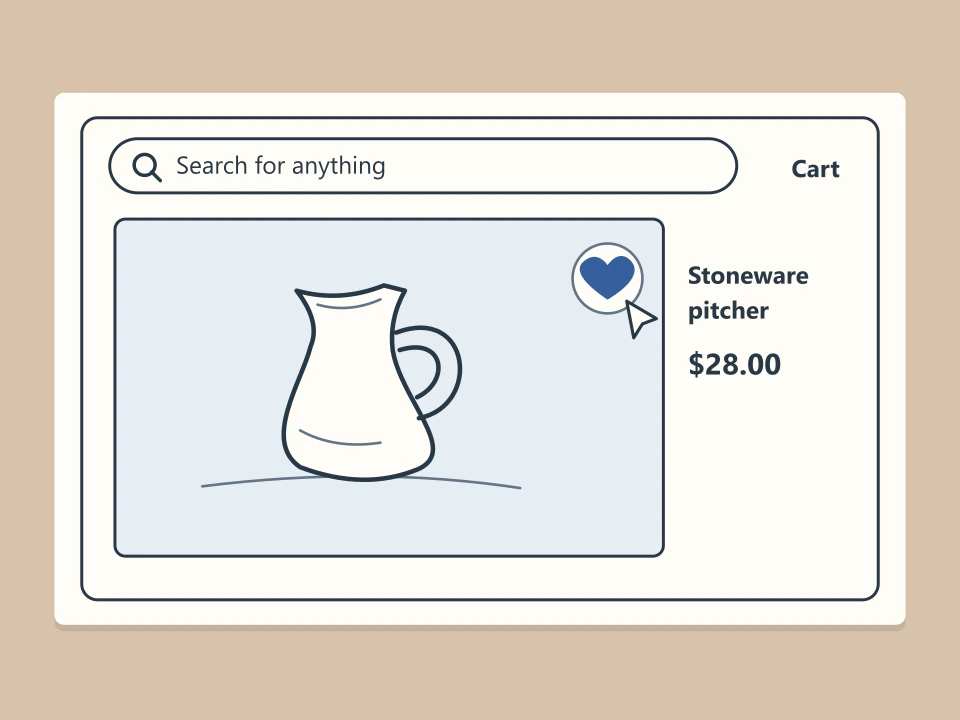
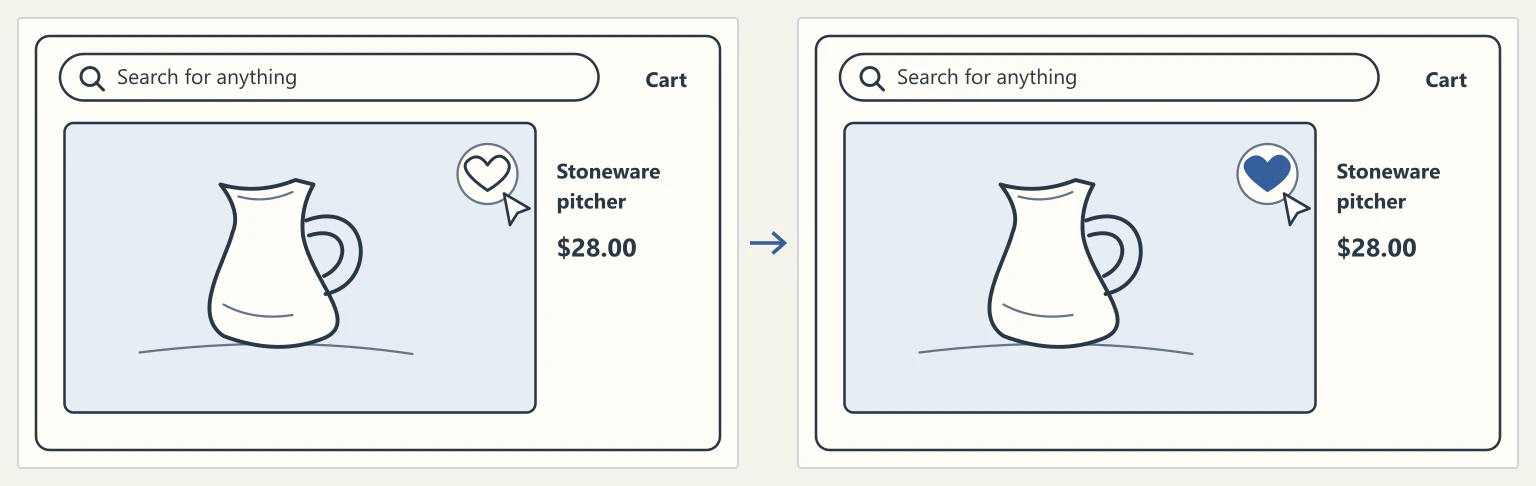
Select the heart on a listing to save it to Favorites. You can revisit saved items or group them into a collection for something specific, such as gift ideas.
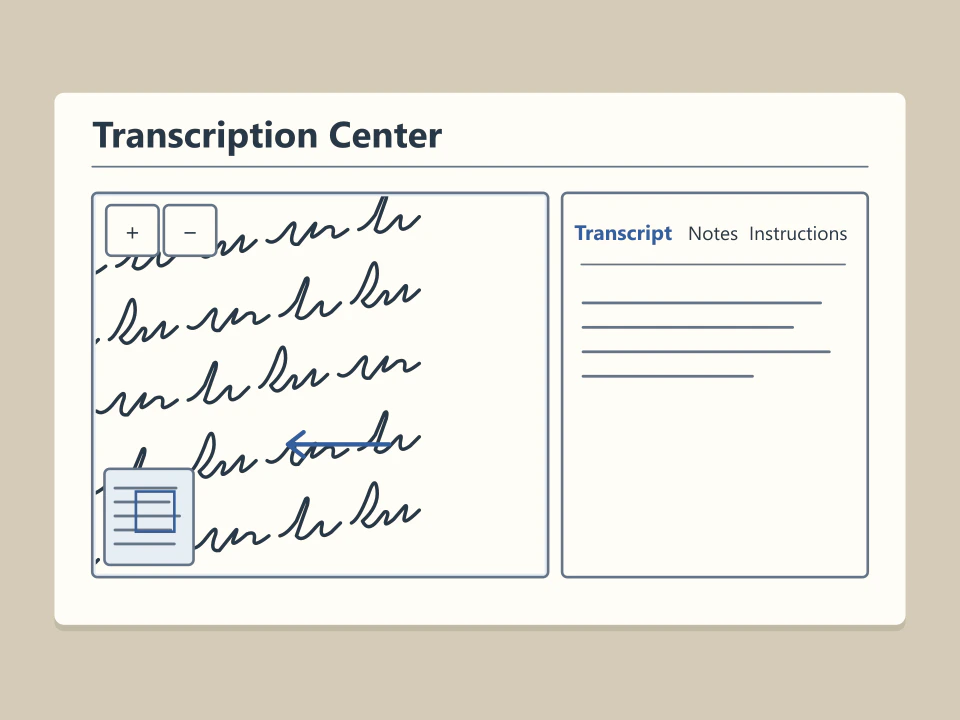
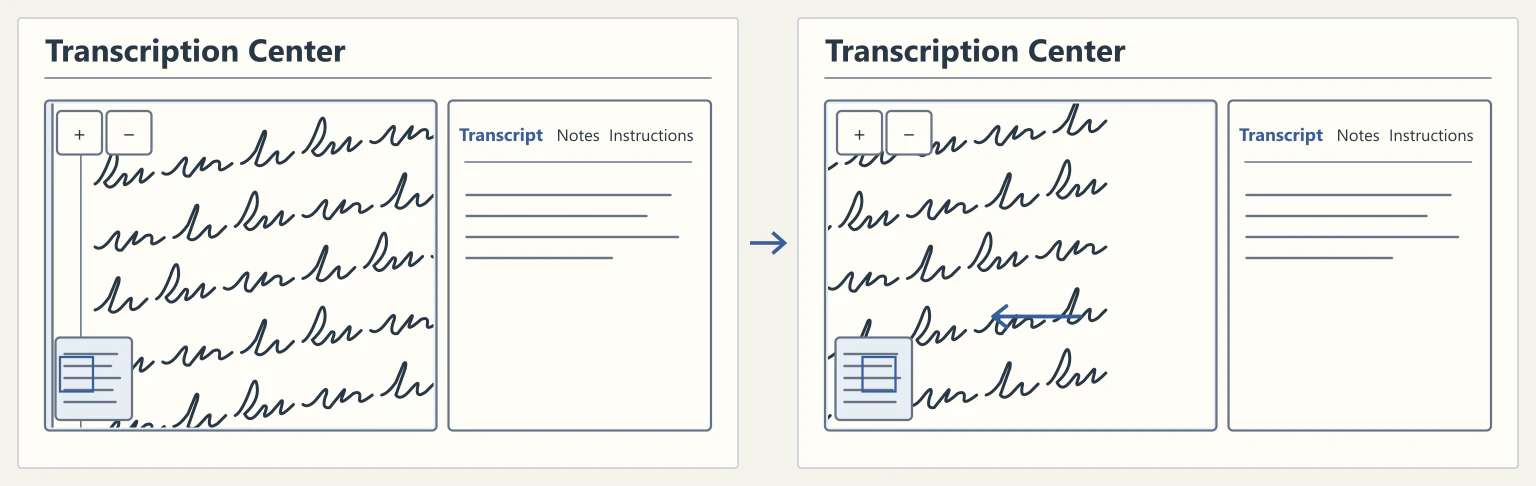
Magnify a hard-to-read word in the document being transcribed. Pan across the enlarged page to follow the rest of the line at the same scale.
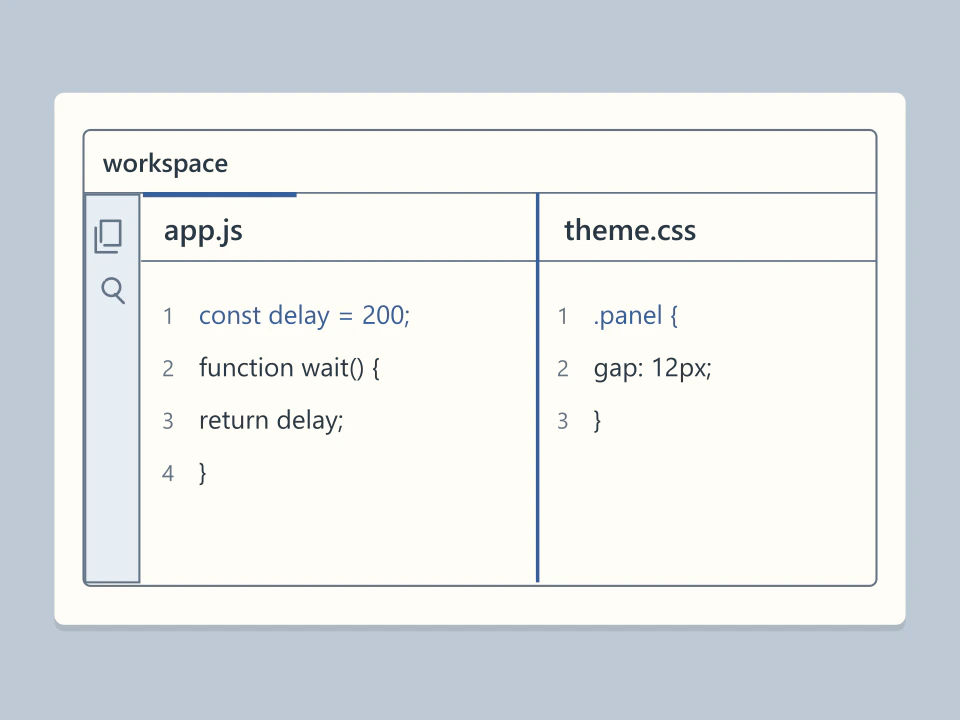
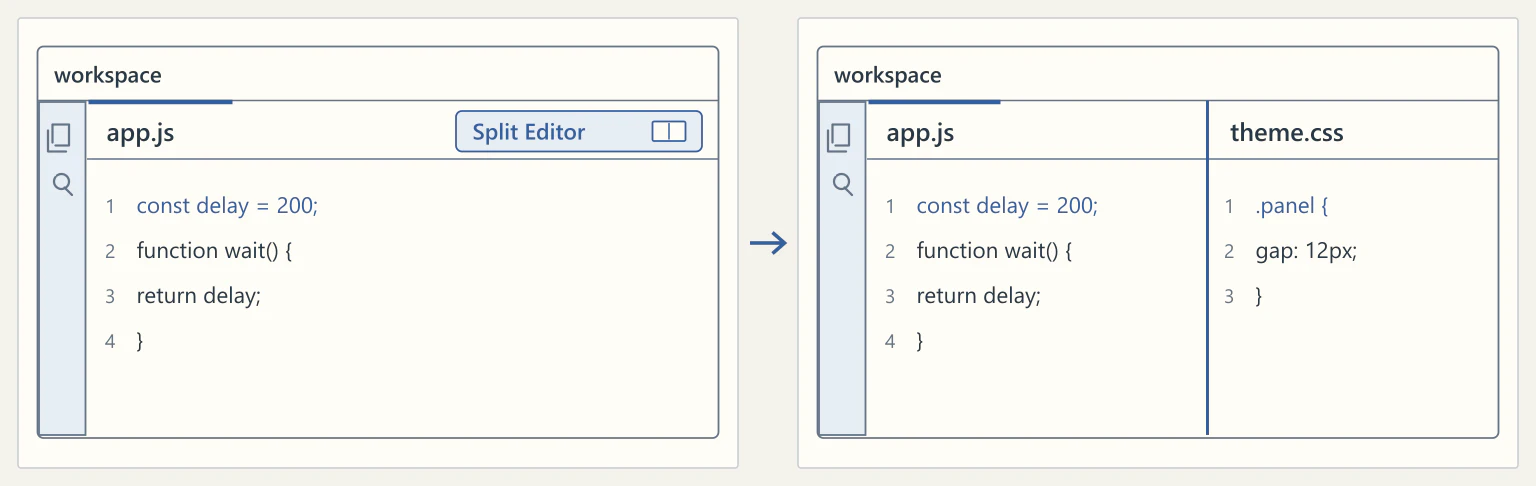
Split the editor to open another editor group and view two files side by side. Resize the editors to give a longer piece of code more room while keeping the other file in sight.
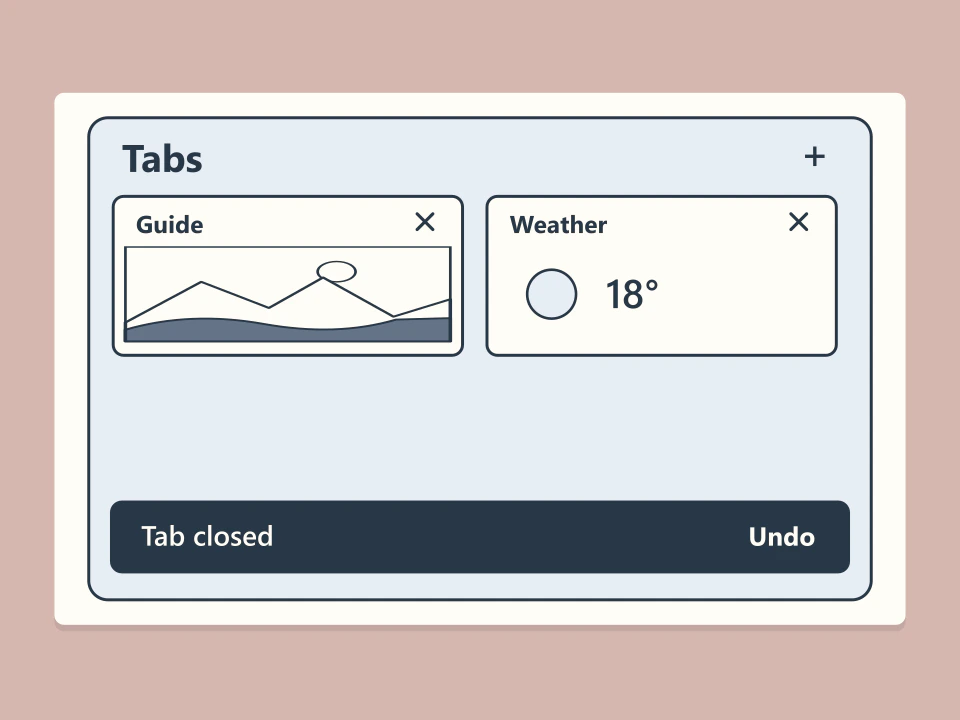
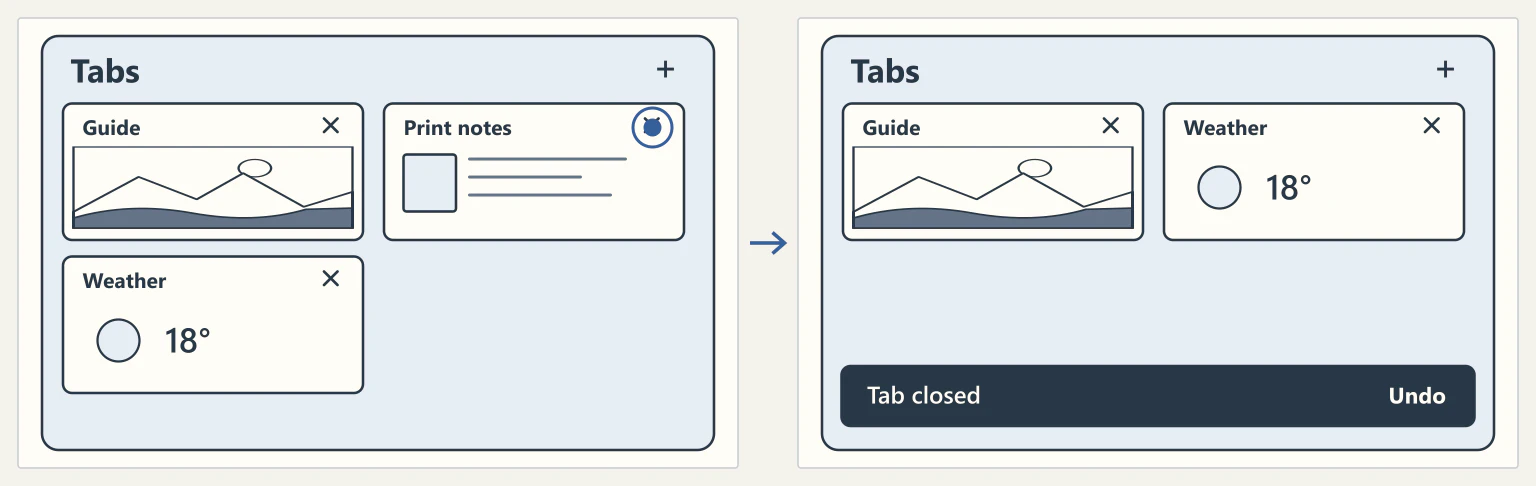
Close a tab in the Android tab tray and a brief notice appears. Tap Undo while it is visible to reopen that tab.
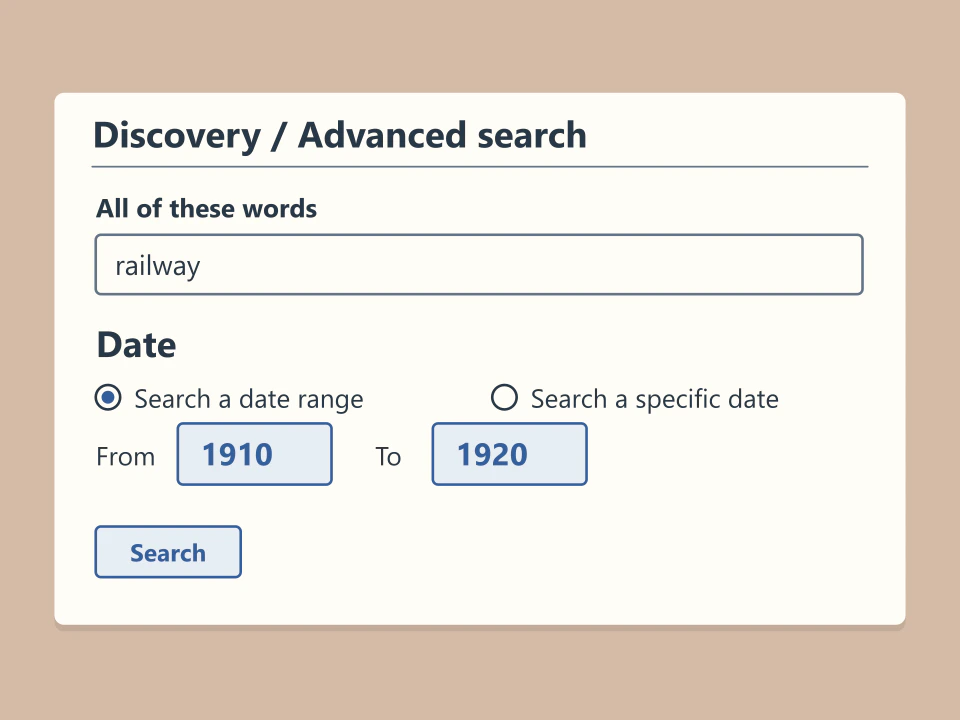
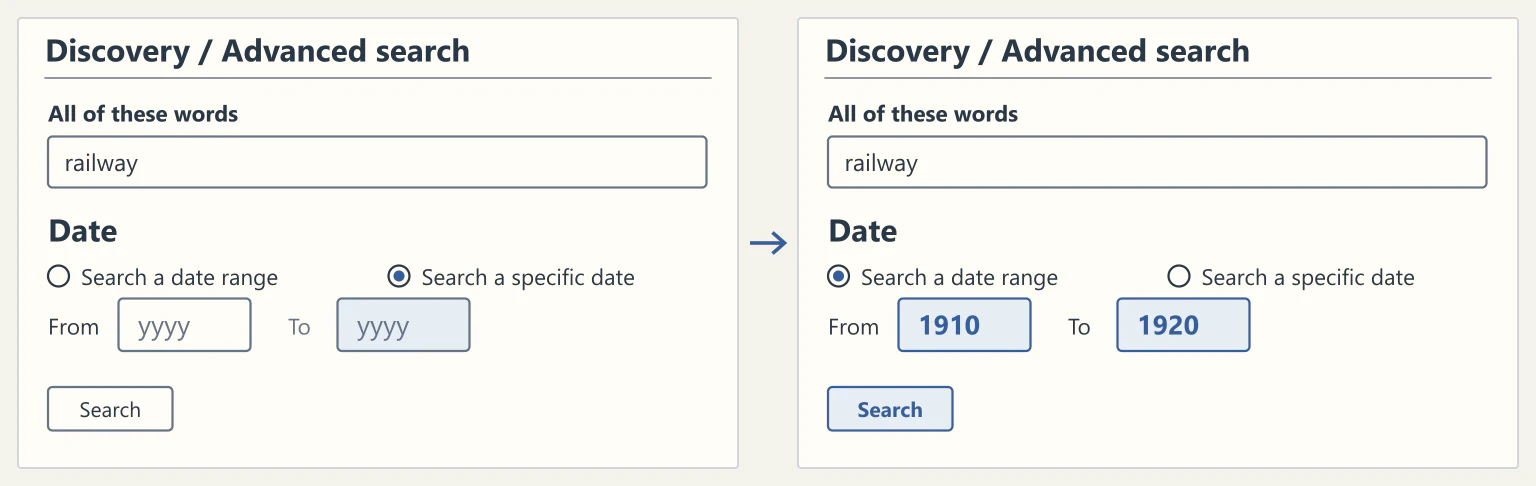
In Discovery’s advanced search, choose the date-range option to enter a starting and ending year. Submit both years with a keyword to find records covering that period.
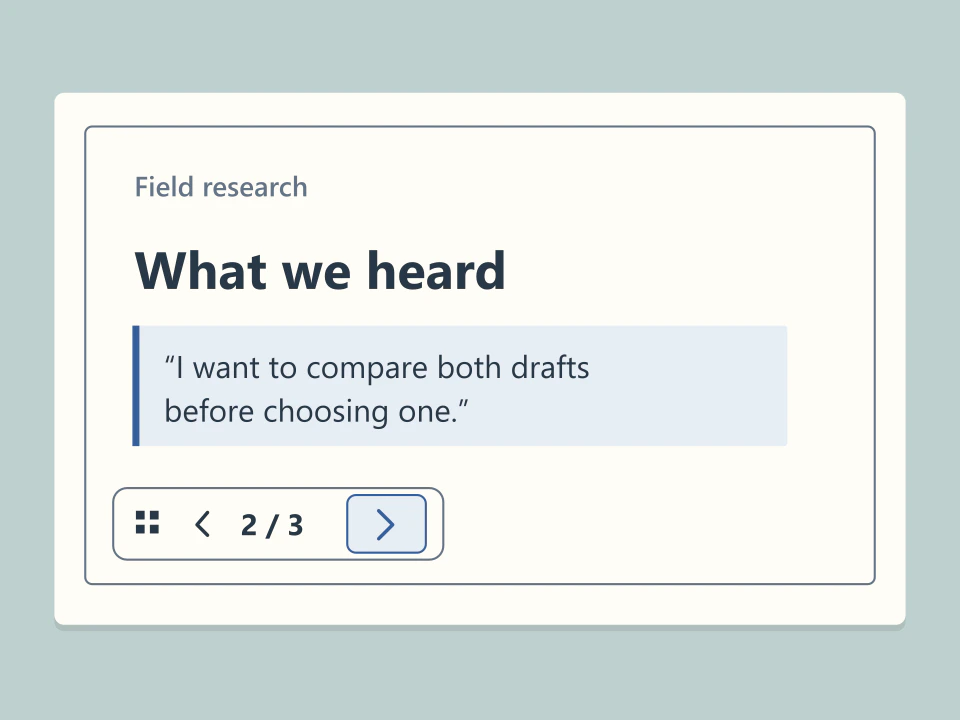
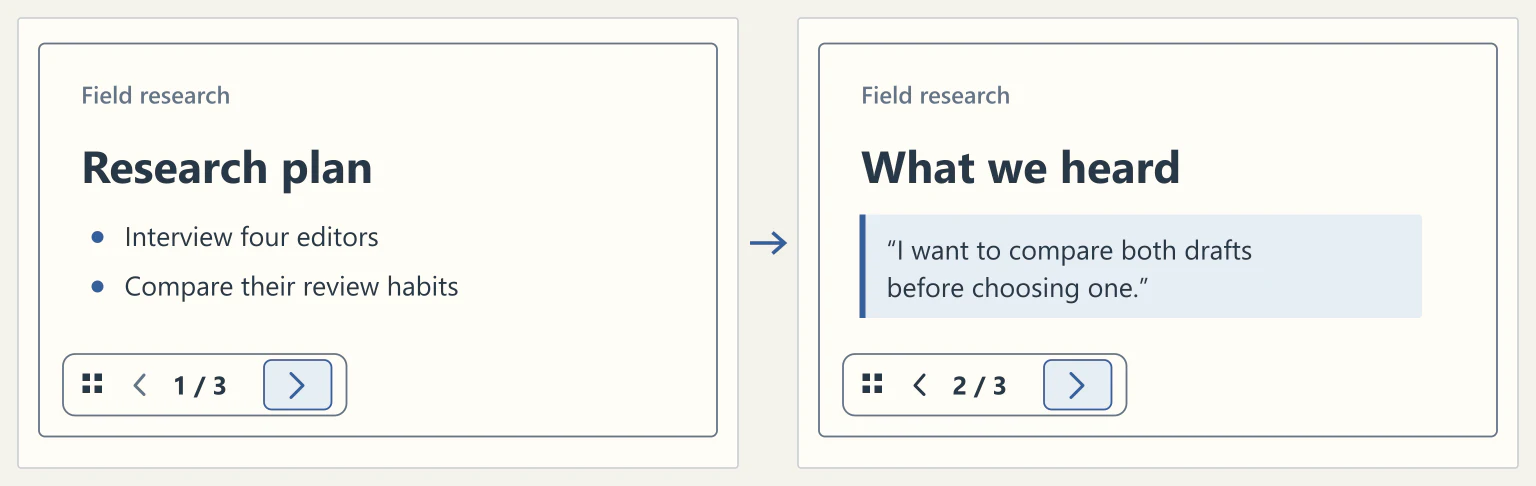
Use the arrow keys or on-screen arrows to advance through the board’s frames in presentation mode. To skip ahead, open the slides panel and select the frame from the grid.
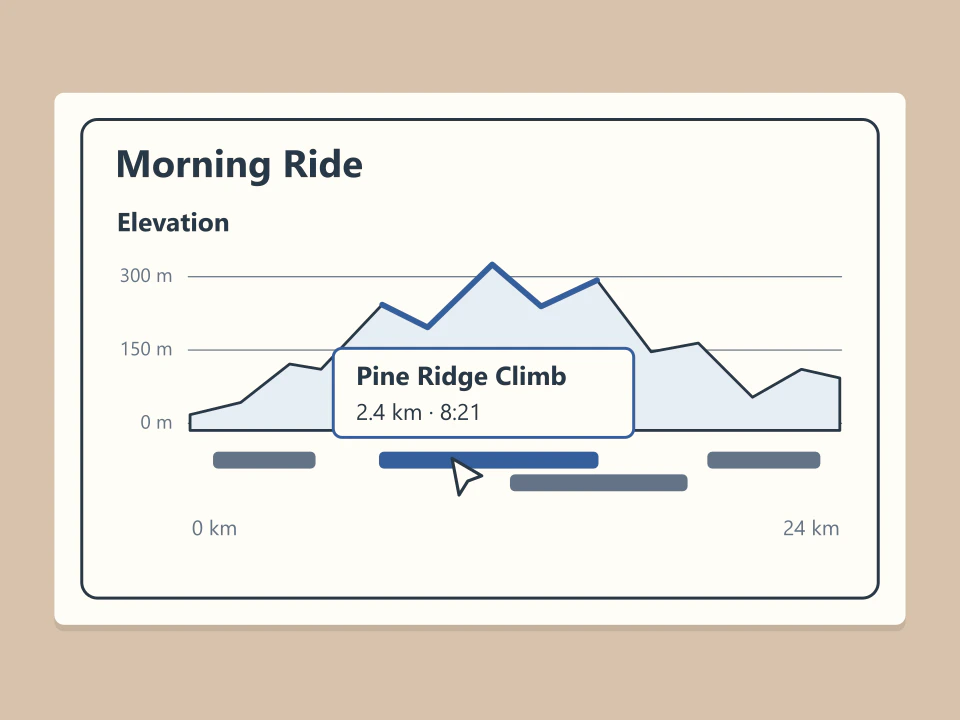
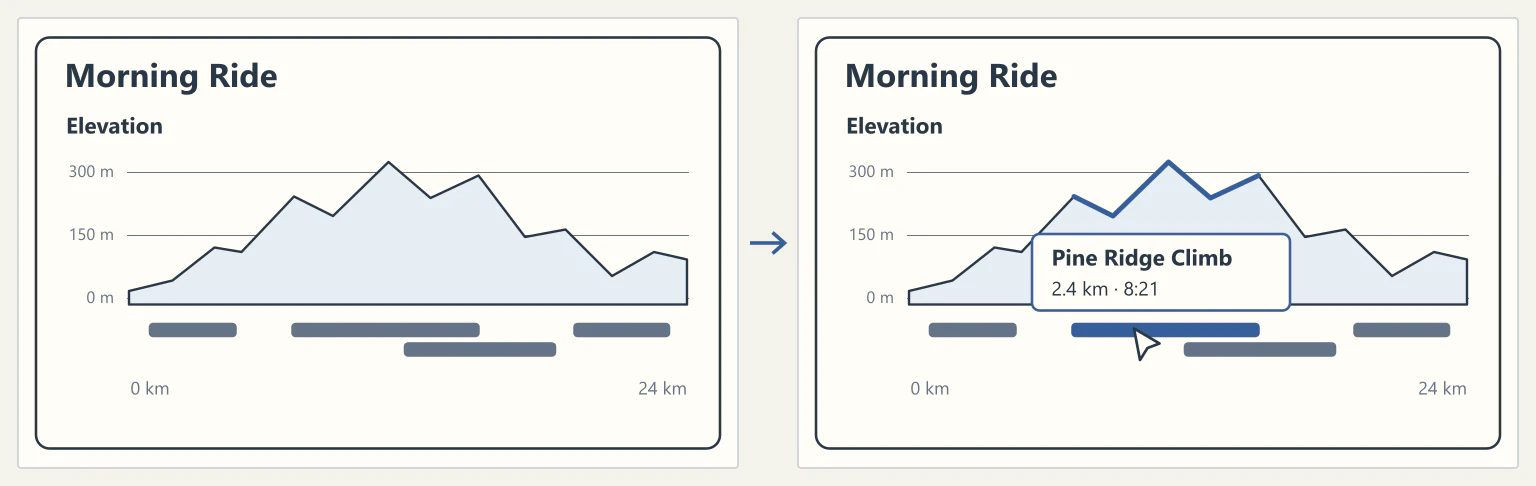
On a ride activity page, bars beneath the elevation profile mark the segments you rode. Hover over a bar for a quick summary, then click it to open the analysis for that effort.