
Move a box to select ink samples and table rows
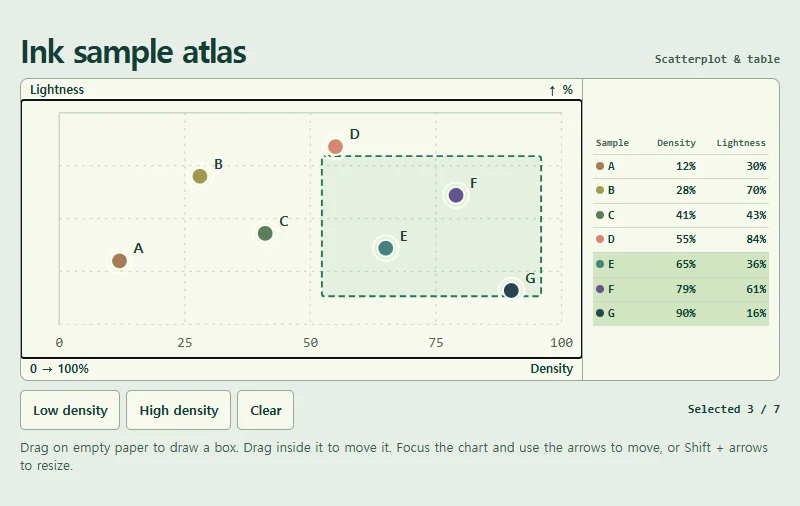
Draw a box over seven samples arranged by density and lightness. Enclosed dots and their table rows light up together.
 Try the motion
When to use it
Inspect individual records within two simultaneous value ranges.
How the motion works
Check both axes and include points on the boundary. Clearing removes the highlight from dots and rows together.
How to use it
- iOS · Android
- Drag on empty paper to draw, then inside the box to move it. The density buttons also select ranges.
- PC
- Focus the plot. Arrows move the box, Shift + arrows resize it, and Escape clears it.
Example files and implementation notes
Choose a device in the demo and save the motion to your collection to download the working HTML and implementation notes as a ZIP.